


Features
- 6 Unique slides
- Fully editable and easy to edit in Microsoft Powerpoint, Keynote and Google Slides
- 16:9 widescreen layout
- Clean and professional designs
- Export to JPG, PDF or send by email


Do you have any questions?
Recommend


6 slides
6-Step Business Process Presentation
Clearly map out workflows with this 6-step business process presentation. Ideal for project managers and strategists, this horizontal timeline helps break complex tasks into digestible phases. With editable icons, color highlights, and step-by-step layout, it's easy to customize in PowerPoint, Keynote, or Google Slides for any professional setting.


7 slides
Stakeholder Analysis Infographics Presentation Template
A stakeholder analysis is a process used to identify stakeholders and analyze the needs of each stakeholder. The purpose of a stakeholder analysis is identifying the people who are involved, or interested in your project and determining how best to involve and communicate with each of them throughout. This template is the perfect tool to help you embrace, or get started on, your stakeholder analysis. With this template, you are taken through each step of a stakeholder analysis in a strategic and easy-to-follow manner. This template makes it easy to communicate your plan and influence change.


6 slides
Root Cause Steps Infographic
Root Cause Analysis (RCA) is a systematic process used to identify the underlying causes of problems, incidents, or issues in various fields, such as business, healthcare, engineering, and more. This infographic template illustrates the concept of root cause analysis, a method used to identify the underlying causes of a problem or issue. This infographic is a valuable tool for organizations to improve their processes, systems, and outcomes. This template helps in identifying and addressing the underlying issues that may not be immediately obvious, thereby promoting continuous improvement and problem-solving.


3 slides
Governance and Compliance Framework Presentation
Strengthen your organization's structure with our Governance and Compliance Framework template. This visually compelling template is crafted to effectively communicate the integration of governance, compliance, and risk management. It is ideal for demonstrating how these elements collaborate to uphold regulatory standards and manage business risks. Fully compatible with PowerPoint, Keynote, and Google Slides, it's an essential tool for any corporate governance presentation aimed at promoting effective, compliant business practices.


7 slides
Sports Illustrated Infographic Presentation
Sports are an important aspect of our lives that provide numerous physical, mental, social, and personal benefits. This sports infographic is designed to help you create an awesome visual content using all sorts of colorful images, charts and graphs that best describe your sports related project. This template is perfect if you need to share statistics and facts about sports. It contains 7 slides with colorful backgrounds, sport visualizations and an area for you to input your important data. This template is compatible with Powerpoint, keynote and google slides, perfect for your next project!


6 slides
Amortization Schedule Infographic
An amortization schedule is a detailed table that outlines the repayment of a loan over time. This infographic can be a helpful way to visually explain the repayment schedule of a loan or mortgage. Divide it into sections, including an introduction, explanation of terms, example calculations, and key takeaways. Compatible with Powerpoint, Keynote, and Google Slides. Use icons or visuals to represent loan-related concepts, such as a house for mortgages, a money bag for payments, or a graph for interest rates. The line graphs included can show the decreasing principal balance over time, with interest and principal portions highlighted.


5 slides
Crypto Investment Trends and Insights Presentation
Stay ahead of the digital asset curve with the Crypto Investment Trends and Insights presentation template. This slide features a visually compelling mining cart illustration filled with cryptocurrency symbols, perfect for presenting market data, blockchain innovations, or digital asset strategies. Highlight three core insights using customizable text areas and icons. Ideal for crypto analysts, fintech professionals, and investment briefings. Fully editable in PowerPoint, Keynote, and Google Slides.


6 slides
Adapting to Change in Business Presentation
Effectively illustrate business adaptability with this dynamic domino-effect slide. Designed to visually represent cause-and-effect relationships, this template is ideal for change management, business strategy, and risk assessment presentations. The falling blocks symbolize challenges, interventions, and strategic adjustments to drive impactful decision-making. Fully editable��customize colors, text, and layout to match your needs. Compatible with PowerPoint, Keynote, and Google Slides for seamless use.


5 slides
Creative Alphabet Display Template
Make your message memorable with the Creative Alphabet Display Template Presentation. This slide uses bold, interlocking letter shapes to showcase four key ideas in a linear, eye-catching format��perfect for step-by-step processes, value breakdowns, or themed concepts. Fully editable in PowerPoint, Keynote, and Google Slides.


5 slides
Corporate Risk Assessment Framework Presentation
Streamline corporate risk evaluations with a structured framework. This Corporate Risk Assessment Framework provides a clear, organized approach to identifying, analyzing, and managing risks. Ideal for business strategists, project managers, and compliance teams. Fully customizable and compatible with PowerPoint, Keynote, and Google Slides for seamless integration into your workflow.


5 slides
Sustainable Growth and Green Policy Presentation
Showcase your eco-initiatives with the Sustainable Growth and Green Policy Presentation. This unique leaf-shaped diagram highlights four key environmental pillars��ideal for presenting climate strategies, energy policies, or green development goals. With a sleek and modern design, it��s perfect for NGOs, government briefings, or corporate sustainability reports. Editable in Canva, PowerPoint, Keynote, and Google Slides.


12 slides
Employee Roles and Professional Profiles
Break down team structure and highlight individual strengths with this modern hub-and-spoke layout��perfect for showcasing employee roles, departments, or professional profiles. Whether you're onboarding, presenting org charts, or outlining responsibilities, this slide keeps it all clear and cohesive. Fully compatible with PowerPoint, Keynote, and Google Slides.


19 slides
Zenith Sales Proposal Presentation
Get ready to blow your clients away with this electrifying sales proposal template! Packed with sections on project scope, bold objectives, timelines, and jaw-dropping pricing, it��s designed to make a powerful impact. The sleek, cutting-edge design ensures you��ll leave a lasting impression. Fully compatible with PowerPoint, Keynote, and Google Slides!


6 slides
IT Infrastructure and Services Management Presentation
Visualize key operations clearly with the IT Infrastructure and Services Management Presentation. This slide features a circular diagram paired with five editable content blocks��perfect for mapping infrastructure elements like networks, servers, and tools. The icon-ring design adds clarity and structure to complex workflows. Fully compatible with PowerPoint, Keynote, and Google Slides.


22 slides
Shield Digital Agency Strategy Plan Presentation
Embark on a journey to elevate your digital agency with this comprehensive and sleek presentation template! Perfect for showcasing your agency��s strengths, strategies, and successes, this template covers everything from market analysis to client testimonials. It��s designed to make your agency��s strategy plan stand out. Compatible with PowerPoint, Keynote, and Google Slides for seamless use.


5 slides
USA Demographic Map Presentation
Visualize regional insights effortlessly with this USA Demographic Map Presentation. Featuring editable color-coded state maps and matching infographic sections, this template is ideal for presenting population data, customer distribution, or market segmentation. Fully compatible with PowerPoint, Keynote, and Google Slides.


28 slides
Glowspire Brand Guidelines Proposal Presentation
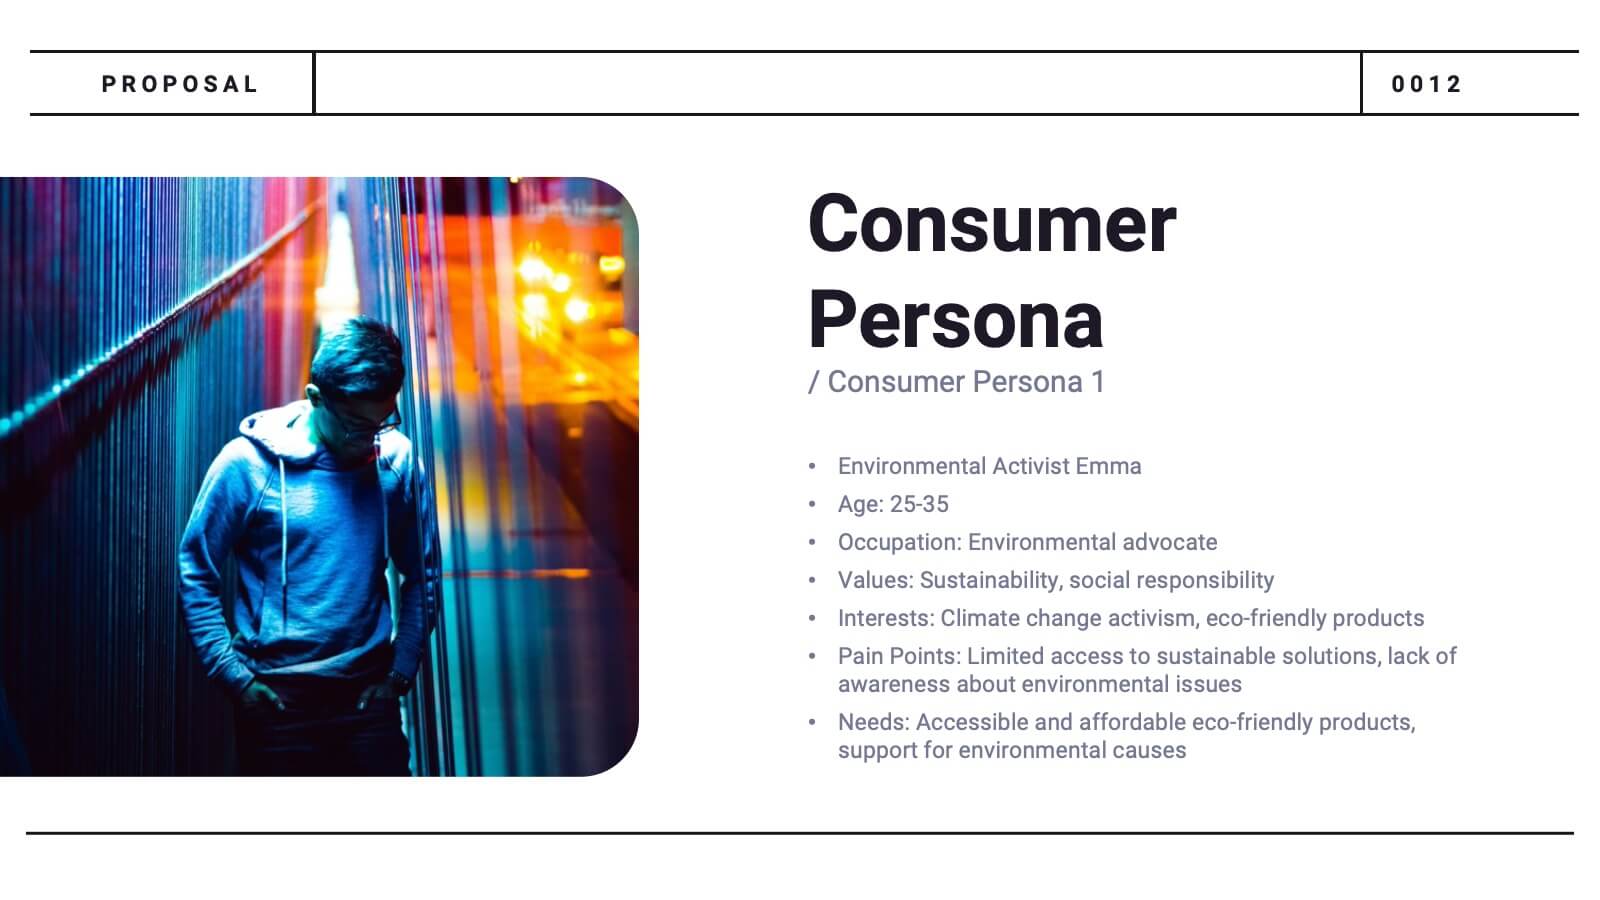
This brand identity template covers essential components: logo, imagery, color, typography, and voice & tone. It includes slides for consumer persona, market analysis, USP, brand positioning, and strategy. Ideal for establishing a cohesive brand, it highlights brand touchpoints across digital, print, packaging, and advertising mediums. Customizable for various platforms.