Features
- 6 Unique slides
- Fully editable and easy to edit in Microsoft Powerpoint, Keynote and Google Slides
- 16:9 widescreen layout
- Clean and professional designs
- Export to JPG, PDF or send by email
Recommend
6 slides
Market Pressure Analysis with Five Forces Presentation
The Market Pressure Analysis with Five Forces Presentation offers a creative and easy-to-understand layout for applying Porter's Five Forces model. Designed with a distinctive star-like visual, each force—New Entry, Supplier, Competitive Rivalry, Buyer, and Substitutes—is clearly labeled with alphabetical markers (A–E) and corresponding icons. This format is perfect for showcasing industry dynamics in strategy meetings, marketing analysis, or competitive research. Each force can be highlighted individually for focused discussion. Fully customizable and compatible with PowerPoint, Keynote, and Google Slides.
8 slides
Workflow Diagram Presentation
The "Workflow Diagram Infographic" template is designed to clearly illustrate the sequence of tasks or stages within a project or business process. Each segment of the circular design is allocated for a specific phase, equipped with a title and descriptive area, and supported by distinct icons for quick identification. This layout is ideal for delineating task dependencies and operational sequences, helping to simplify and communicate complex procedures. It's particularly useful for project managers, operational leads, and trainers in explaining workflows and processes efficiently. This infographic serves as an effective visual tool for presentations aimed at streamlining discussions around process improvements and team alignments.
5 slides
K–12 School Planning and Curriculum Map Presentation
Visualize your school year with the K–12 School Planning and Curriculum Map Presentation. Designed for academic teams and administrators, this circular diagram helps outline yearly goals, subject milestones, or grade-level plans in five clear segments. Fully editable in PowerPoint, Keynote, Google Slides, and Canva for total customization.
5 slides
Veterinary Research and Innovation Presentation
This slide blends a professional layout with a touch of charm using a magnifying glass and pet illustration to highlight four veterinary milestones. Ideal for research updates, innovation pathways, or veterinary breakthroughs. Easily editable in PowerPoint, Keynote, or Google Slides.
5 slides
Cybersecurity Protocols and Threat Response Presentation
Visualize your security framework with the Cybersecurity Protocols and Threat Response presentation slide. Featuring a central lock icon surrounded by four quadrant-based callouts and symbolic icons (e.g., fingerprint, shield, malware), it’s ideal for outlining access controls, incident response, and threat monitoring strategies. Fully editable in PowerPoint, Keynote, and Google Slides.
5 slides
Quality Control with Six Sigma Strategy Presentation
Showcase your quality control framework using the Quality Control with Six Sigma Strategy Presentation. This modern layout highlights each stage of the DMAIC process in a visually engaging format, ideal for Lean Six Sigma teams and continuous improvement professionals. Fully customizable in PowerPoint, Keynote, Canva, and Google Slides.
5 slides
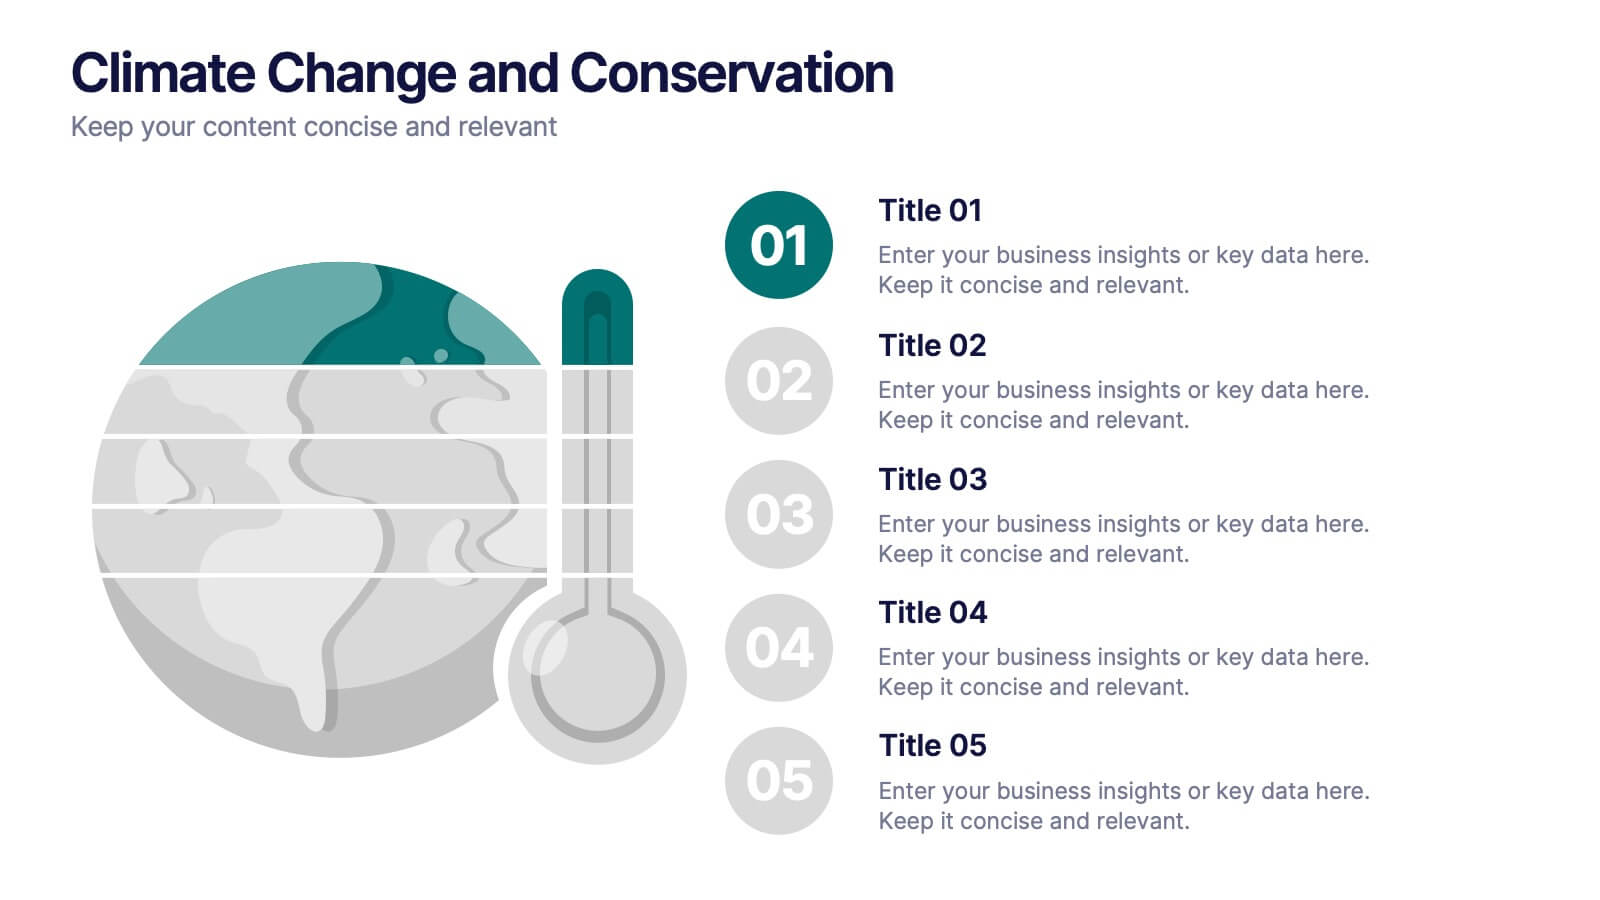
Climate Change and Conservation Presentation
Make your message on climate action clear and compelling with this visually striking template. Featuring an impactful thermometer and globe graphic, this layout is perfect for showcasing key climate data, conservation efforts, and environmental goals. Each step is numbered and color-coded for easy storytelling and clarity. Ideal for NGOs, science educators, and sustainability advocates. Fully editable in PowerPoint, Keynote, and Google Slides.
4 slides
AIDA Marketing Model Presentation
Optimize your marketing strategy with this AIDA Marketing Model Presentation template. Featuring a visually appealing funnel diagram, this template clearly outlines the Attention, Interest, Desire, and Action stages of customer engagement. Ideal for marketers, sales professionals, and business analysts. Fully customizable and compatible with PowerPoint, Keynote, and Google Slides.
26 slides
Financial Literacy Simple Presentation
Our "Financial Literacy" template is a must-have for anyone teaching money management, savings, and investment strategies. Compatible with PowerPoint, Keynote, and Google Slides, it makes financial education accessible and engaging. Introduce the basics with "Financial Literacy: Creating a Smarter Tomorrow" and outline your agenda with the "Table of Contents." The "Meet Our Team" slide can spotlight your financial experts, and the "Three Option Slide" breaks down key concepts like budgeting, saving, and investing. The "This is your big image slide" can visualize financial goals, while "Earn, Save, Invest, Protect." reinforces sound financial habits. Use "This is your Chart Slide" to present data on spending patterns and "Brain Infographic" to explore the psychology of spending. The template's clean design and customizable features make it easy to tailor your financial literacy presentation to any audience, ensuring that your message on smart money management is clear and impactful.
8 slides
Pet Care and Veterinary Clinic Business Presentation
Highlight your clinic’s services with this engaging, paw-themed slide featuring a veterinarian illustration and four colorful pawprints. Perfect for pet care presentations, animal health pitches, or client brochures. Fully editable in PowerPoint, Keynote, or Google Slides for easy customization.
8 slides
Blue Ocean Strategy Business Model Presentation
Chart unexplored market territories with our Blue Ocean Strategy Business Model template! This dynamic presentation tool, designed to simplify complex business strategies, illustrates the pivotal elements of cost reduction and value innovation to unlock new buyer value. Compatible with PowerPoint, Keynote, and Google Slides, it's ideal for strategists aiming to create uncontested market spaces and make competition irrelevant. Perfect for workshops, business meetings, or strategy sessions.
6 slides
Oceania Language Map Infographic
Oceania encompasses the entirety of the Pacific Ocean and its islands. Embark on an enlightening journey through the linguistic tapestry of Oceania with our captivating Oceania Language Map Infographic. This template is your guide to understanding the rich array of languages spoken across this diverse and cultural region. Compatible with Powerpoint, Keynote, and Google Slides. This allows you to incorporate a vibrant and culturally symbolic color palette reflecting the diversity of Oceania. Utilize icons representing different languages for a visually appealing representation.
5 slides
Final Thoughts and Project Recap Presentation
Wrap up your presentation with clarity using this Final Thoughts and Project Recap Presentation. Designed with a modern vertical hexagon layout, this slide highlights four key conclusions or reflections with matching icons and clean text alignment. It's perfect for summarizing insights, actions, or final outcomes. Fully editable in PowerPoint, Keynote, Google Slides, and Canva.
26 slides
Real Estate Company Profile Presentation
Step into the world of real estate, where every brick tells a story and every home harbors a dream. Our warm and bold template, draped in varying shades of brown, encapsulates the essence of properties, from cozy homes to towering skyscrapers. Boasting tailored graphics, detailed icons, and versatile image placeholders, it's more than just a visual aid; it's an experience. Seamless compatibility ensures it's ready for Powerpoint, Keynote, or Google Slides. An invaluable asset for realtors, property managers, housing agencies, or anyone looking to make an impact in the real estate market. Present with confidence; let every property shine.
5 slides
Patient Care and Hospital Management Presentation
Communicate critical aspects of Patient Care and Hospital Management with this structured presentation template. Featuring a unique IV-drip-inspired design, this layout visually represents the flow of healthcare processes, making it ideal for hospitals, medical institutions, and healthcare professionals. Use it to outline treatment protocols, patient management strategies, and operational workflows. Fully editable and compatible with PowerPoint, Keynote, and Google Slides for seamless customization.
5 slides
Key Milestone Tracker for Projects Presentation
Track project progress and celebrate wins with the Key Milestone Tracker for Projects Presentation. This template features a vertical flow of trophy icons embedded in hexagons, each representing a major milestone. Ideal for showcasing achievements, timelines, or key phases in a project lifecycle. Fully customizable and compatible with PowerPoint, Keynote, and Google Slides.
6 slides
United States Energy Map Infographics
The "United States Energy Map" infographic template, suitable for PowerPoint, Keynote, and Google Slides, is an essential tool for visualizing the nation's energy landscape. Perfect for energy analysts, educators, and policymakers, this template vividly displays the distribution of various energy sources across the U.S., including renewable installations, fossil fuel production, and power plants. Key statistics and trends in energy consumption, production, and sustainability are highlighted, providing a comprehensive overview of America's energy profile. The color scheme effectively differentiates energy types and regions, making the presentation both visually appealing and informative. Ideal for energy sector presentations, educational lectures, or policy discussions, this template ensures the "United States Energy Map" is communicated clearly and engagingly, offering a snapshot of the country's diverse energy dynamics.


