


Features
- 4 Unique slides
- Fully editable and easy to edit in Microsoft Powerpoint, Keynote and Google Slides
- 16:9 widescreen layout
- Clean and professional designs
- Export to JPG, PDF or send by email


Do you have any questions?
Recommend


5 slides
Iceberg Diagram Infographics
An iceberg diagram is a visual representation that illustrates the concept of an iceberg, where only a small portion is visible above the waterline while the majority of its mass remains hidden beneath the surface. This infographic template illustrates the concept of an iceberg as a metaphor for various topics or phenomena. The infographic effectively communicates the idea that there is more to a subject than what meets the eye, with a significant portion hidden beneath the surface. This template is versatile and can be used to represent a wide range of subjects, such as psychology, business, ecology, or personal development.


23 slides
Imaginix Digital Strategy Presentation
Plan and execute your business strategy with this sleek and modern template. Covering key areas such as SWOT analysis, competitive landscape, performance metrics, and implementation plans, it��s perfect for professionals aiming to optimize digital initiatives. Fully customizable and compatible with PowerPoint, Keynote, and Google Slides.


7 slides
United States Market Map Infographic
Navigate the vastness of the United States with our meticulously designed map infographic. Rendered in a pristine white background, this template is adorned with the patriotic fervor of red, the tranquility of blue, and the charm of purple. Whether it's for market segmentation, regional data visualization, or a travel itinerary, the infographic seamlessly blends informative value with visual appeal. This US map, compatible with Powerpoint, Keynote, and Google Slides, offers custom-made icons and flexible image placeholders to suit varied purposes. Unfold stories from coast to coast, showcasing the diverse tapestry that is the United States.


7 slides
Drawing Anatomy Infographic
Dive into the captivating world of human anatomy with our drawing anatomy infographic. Crafted with vibrant hues of green, orange, red, and blue, this template brings to life the intricacies and artistry of the human form. Whether you're an aspiring artist, a seasoned illustrator, or an educator, this infographic is tailored to enhance your understanding or teaching of anatomical details. The fun, colorful design ensures engagement, making learning a visually pleasing experience. Seamlessly incorporate it into PowerPoint, Keynote, or Google Slides for versatile and effective presentations.


6 slides
Target Market Analysis Infographics
Present your target market analysis with our vibrant and professional infographic template. Tailored for PowerPoint, Keynote, and Google Slides, this template is an ideal choice for marketers, business analysts, and entrepreneurs who aim to communicate their market insights effectively. The design of this template is focused on showcasing market demographics, consumer behaviors, and segmentation in a visually compelling manner. Its modern layout and vibrant color scheme are crafted to capture attention while maintaining a professional tone. This makes it perfect for presentations that need to convey complex market data in an understandable and engaging way. What sets this template apart is its versatility and ease of use. It allows you to highlight key aspects of your target market analysis, from demographic breakdowns to consumer preferences. Whether you're presenting to stakeholders, team members, or at a conference, this infographic template will help you deliver your message with impact and clarity.


8 slides
Economic Improvement in South America Map Presentation
Highlight regional performance with this South America economic growth map. Featuring 3D bar charts and country-specific markers, it��s ideal for visualizing financial progress, investments, or development trends. Fully editable in PowerPoint, Google Slides, and Keynote, this layout is perfect for reports, forecasts, and business reviews with a geographic focus.


5 slides
Diversity in Movies Infographics
Diversity In Movies can have a positive impact on society by promoting acceptance of different cultures, and by promoting messages of equality and social justice. This is a visually stunning vertical infographic template that will help you illustrate and communicate important information about diversity in movies. This template includes various design elements such as icons, illustrations, and graphs, all of which can be easily customized to fit your specific needs. With its bold colors and eye-catching design, this template is sure to capture the attention of your audience and make your message stand out.


6 slides
Product Development Roadmap Presentation
Visualize your innovation journey with this Product Development Roadmap template. Perfect for outlining each stage from concept to launch, it keeps teams aligned on goals and timelines. Ideal for startups, tech teams, or product managers. Fully editable in PowerPoint, Keynote, and Google Slides for flexible, streamlined use.


6 slides
Bitcoin and Blockchain Technology Presentation
Unlock the potential of cryptocurrency and distributed ledger technology with our "Bitcoin and Blockchain Technology" presentation templates. These templates are designed to elucidate complex concepts in an understandable format, making them ideal for educators, technologists, and business professionals. Compatible with PowerPoint, Keynote, and Google Slides, they are a versatile tool for anyone looking to explain or explore the innovative world of blockchain.


4 slides
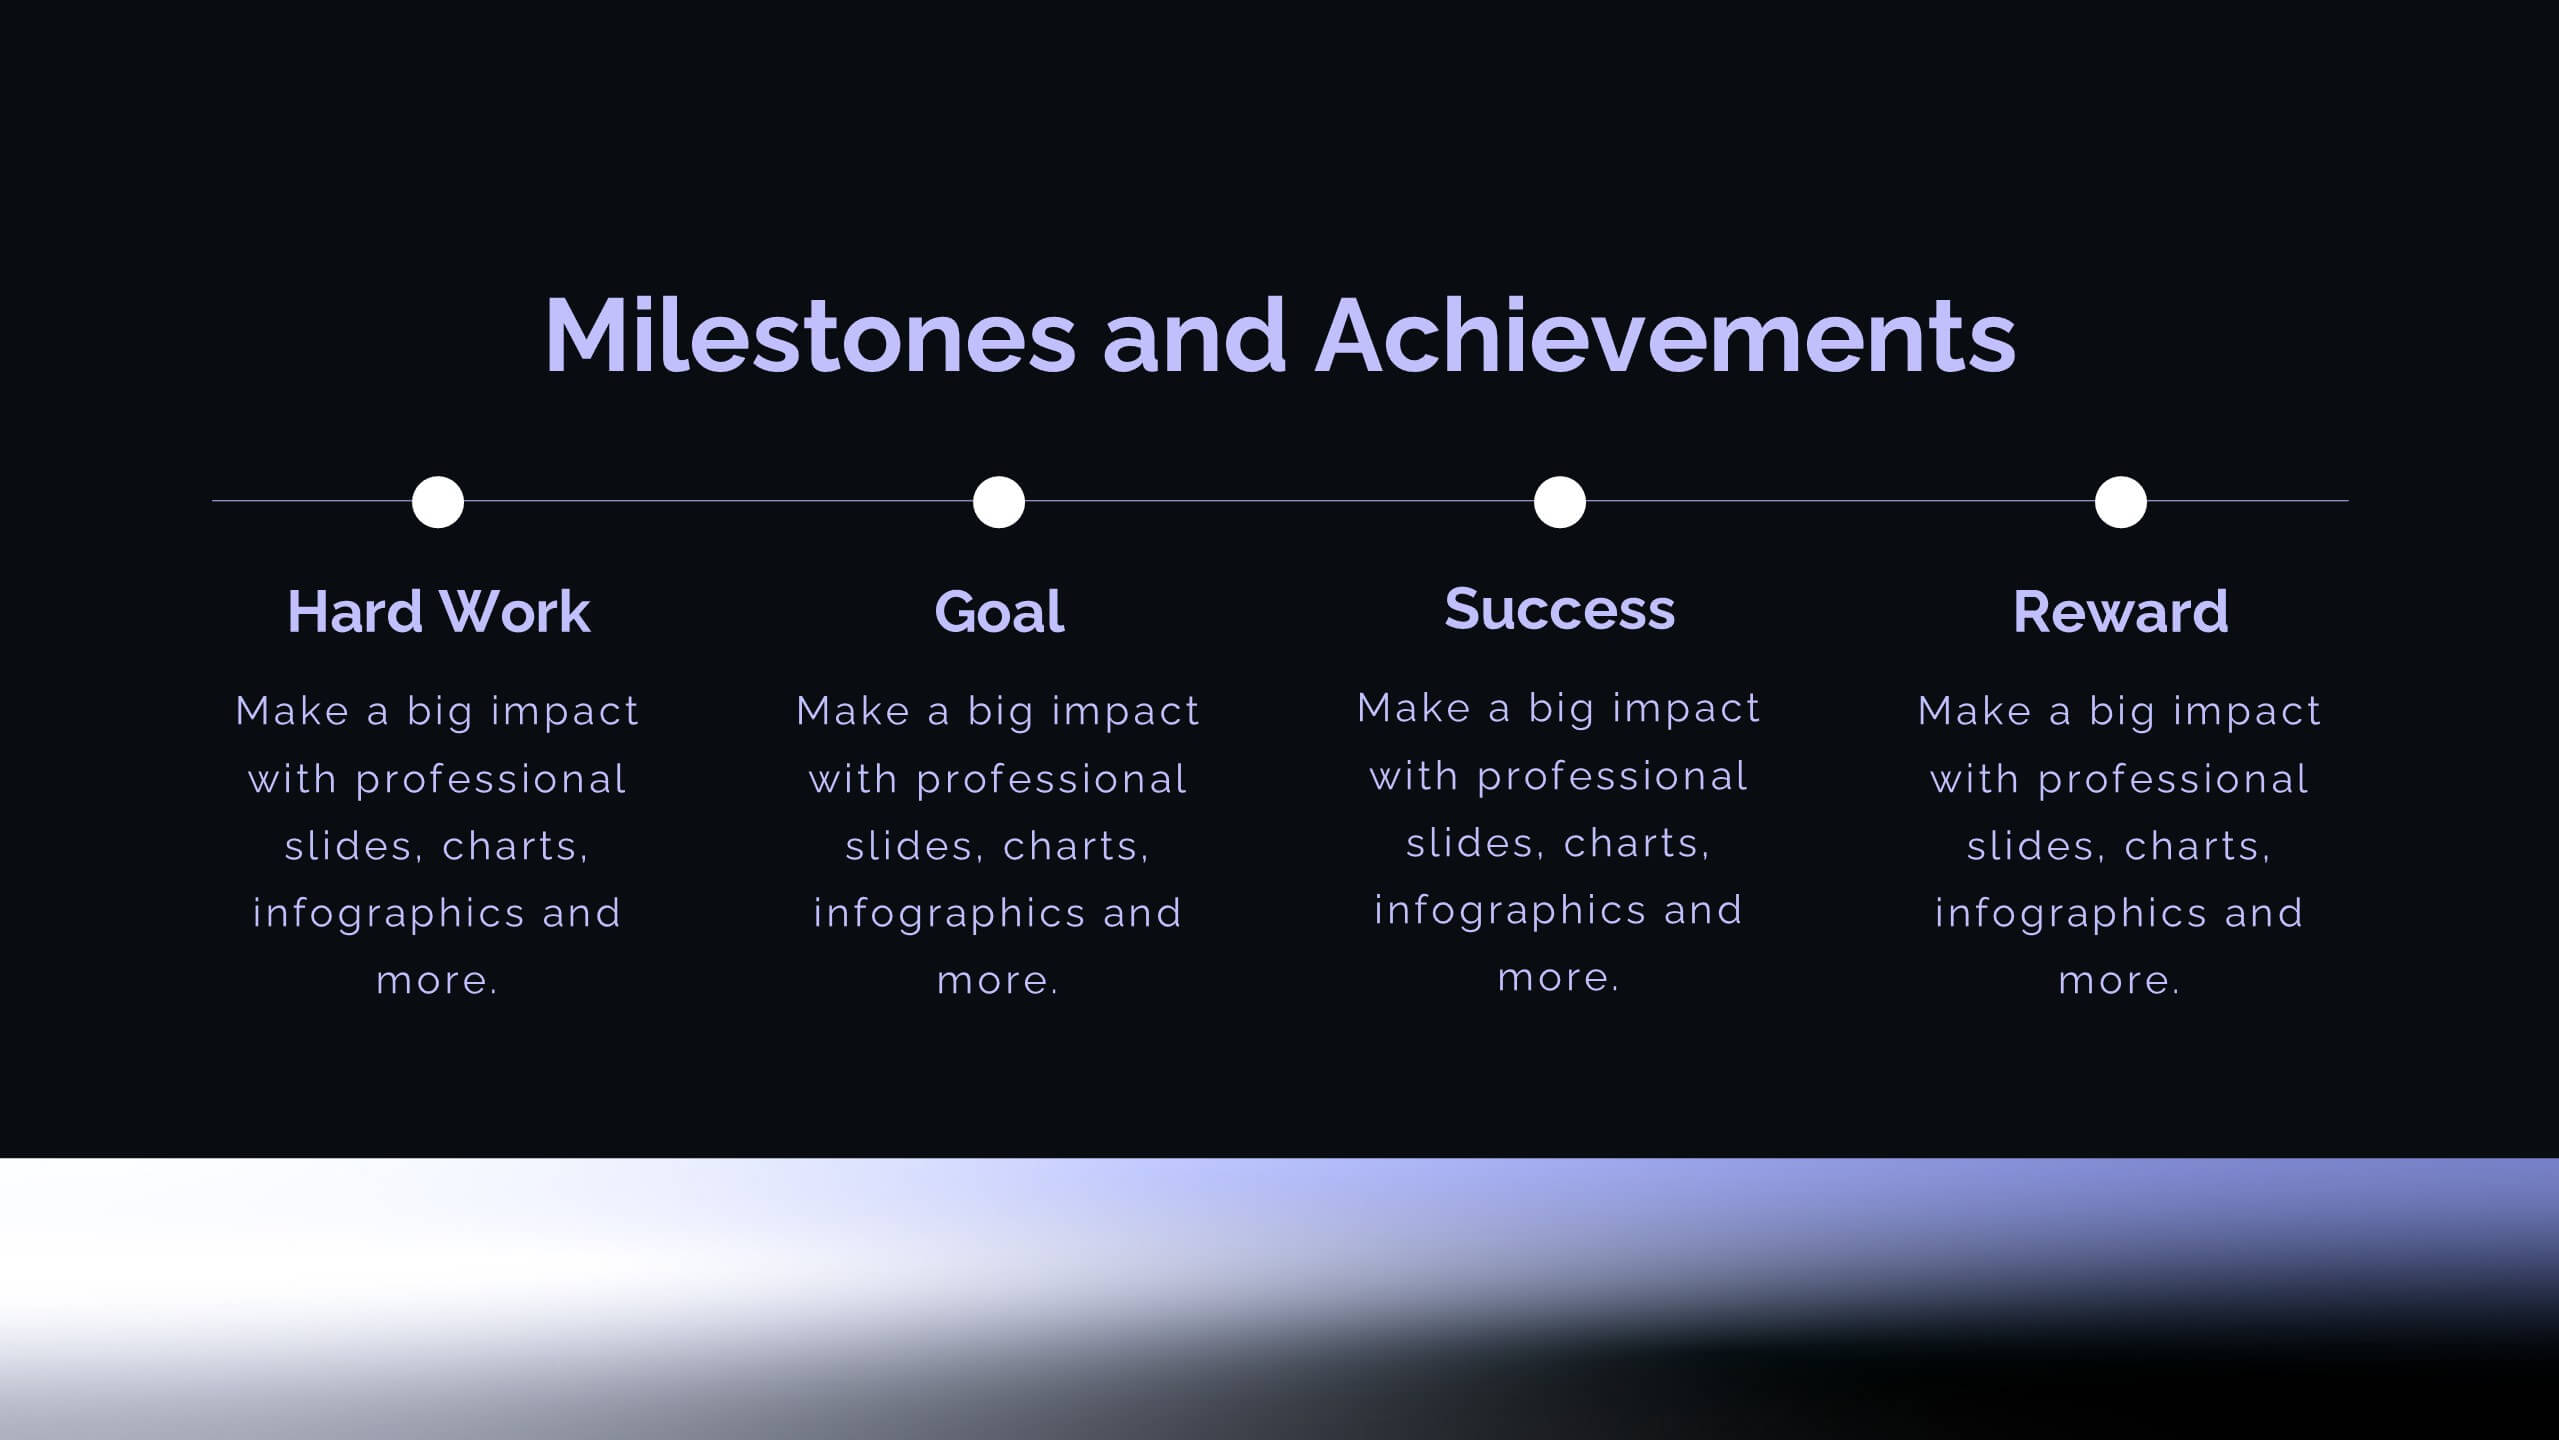
Key Business Insights Executive Summary
Present your insights like a pro with this dynamic, timeline-inspired slide that makes key data points easy to follow. Designed to highlight four major takeaways or milestones, this visual format is ideal for summarizing business progress, strategy updates, or operational highlights. Fully editable in PowerPoint, Keynote, and Google Slides.


5 slides
Watercolor Accent Style Template Presentation
Add subtle creativity to your slides with this Watercolor Accent Style Template. Ideal for timelines, progressions, or process visualization, this layout features numbered brushstroke segments in soft, hand-painted textures. Use it to highlight key points with elegance and clarity. Fully editable in PowerPoint, Google Slides, and Canva.


6 slides
Vision Statement Development Guide
Craft a powerful company vision with this eye-catching layout��literally. Centered around a bold visual icon, this slide helps you organize six core ideas or values that shape your future direction. It��s perfect for strategy workshops, leadership meetings, or branding sessions. Fully compatible with PowerPoint, Keynote, and Google Slides.


23 slides
Starbloom Corporate Strategy Report Presentation
This Corporate Strategy Report Presentation Template provides a sleek and professional layout to present business insights, market opportunities, and strategic goals. It covers essential aspects like SWOT analysis, financial performance, risk management, and future outlook, making it perfect for corporate reports and investor briefings. Fully editable in PowerPoint, Keynote, and Google Slides.


6 slides
Business Value Proposition Presentation
Ignite your strategy with this captivating template that highlights your unique business value. This tool breaks down key value propositions, market differentiators, and customer benefits in an engaging format. Perfect for pitching ideas, it clarifies competitive advantages and growth opportunities. Compatible with PowerPoint, Keynote, and Google Slides for seamless presentations.


22 slides
Metaphor Advertising Agency Proposal Presentation
The Advertising Agency Proposal Presentation Template offers a polished structure to present your agency's expertise. With slides covering mission, case studies, services, and market analysis, it��s designed to leave a lasting impression. Perfect for securing new clients, it��s fully editable and works seamlessly with PowerPoint, Keynote, and Google Slides.


7 slides
Network Marketing Infographic
Network marketing, is a business strategy where salespersons earn income through both direct sales of products or services and by recruiting new salespeople. This infographic template serves as a compass, guiding you through the intricate pathways of this business model and shedding light on the strategies and dynamics that lead to success. Compatible with Powerpoint, Keynote, and Google Slides. Illustrate a network of interconnected nodes to visualize the structure and growth potential of network marketing, demonstrating how each node represents a potential customer or distributor.


7 slides
Exponential Growth Infographic
Exponential growth refers to a process where a quantity grows at a consistent percentage rate per unit of time. This infographic template takes your audience on a visual expedition through the marvels of exponential expansion, turning complex data into a clear and engaging narrative. Compatible with Powerpoint, Keynote, and Google Slides. This features dynamic visuals like ascending graphs and vibrant charts, this infographic embodies the essence of exponential growth, making this come alive. Showcase the growth trajectory using ascending line graphs or bar charts, visually representing the skyrocketing growth in a way that's easy to comprehend.