Features
- 6 Unique Slides
- Fully editable and easy to edit in Microsoft Powerpoint, Keynote and Google Slides
- 16:9 widescreen layout
- Clean and professional designs
- Export to JPG, PDF or send by email
Recommend
5 slides
CBD Industry Infographics
CBD, or cannabidiol, is a natural compound derived from the hemp plant that has gained popularity in recent years for its potential therapeutic benefits. This infographic template is perfect if you want to educate others on the CBD industry. These vertical infographics are designed to help you provide a concise and engaging way to present facts, statistics, and trends about CBD products, usage, benefits, regulations, and market growth. This template can be used by CBD companies, health professionals, and educational institutions to inform and educate their audience about the industry and important considerations.
4 slides
Executive Summary Business Presentation
Summarize key business insights effectively with this executive summary template! Designed to present an overview of your strategy, problem statement, solutions, and conclusions in a structured format, this layout ensures clarity and impact. Ideal for reports, proposals, and business plans. Fully customizable and compatible with PowerPoint, Keynote, and Google Slides.
2 slides
Modern Business Cover Slide Presentation
Stand out with this bold and contemporary cover slide. The layout features dynamic geometric shapes and an integrated photo section, perfect for making a memorable first impression. Whether you're presenting to clients or stakeholders, this slide combines style and structure to deliver your brand message clearly. Fully customizable and easy to edit in PowerPoint, Keynote, and Google Slides.
5 slides
Physical Science Infographics
Immerse in the realm of physical sciences with our physical science infographics template. Set against a deep cosmos of blues and purples, this template serves as a bridge between complex scientific principles and audiences, ideal for educators, students, and science communicators. The design, balancing creativity and informativeness, integrates stunning graphics and icons, turning data and facts into captivating visual stories. This dark-themed, visually engaging layout is not just an educational tool, but a spark that ignites curiosity and exploration in classrooms, scientific presentations, or educational content, making science both profound and accessible.
4 slides
Pharmaceutical Industry Overview Presentation
Get a comprehensive view of the pharmaceutical sector with the Pharmaceutical Industry Overview Presentation template. This well-structured layout is designed to present key insights, industry trends, and regulatory frameworks in a visually compelling format. Perfect for industry analysts, healthcare professionals, and business executives, this template is fully editable and compatible with PowerPoint, Keynote, and Google Slides.
6 slides
Problem-Solving with Design Thinking
Communicate your innovation process with clarity using the Problem-Solving with Design Thinking Presentation. This slide visualizes the six key phases of the design thinking methodology (e.g., Empathize, Define, Ideate, Prototype, Test, Implement) arranged in a dynamic hexagonal loop. Each section is color-coded and icon-labeled for easy navigation, with editable titles and space for explanatory text. Ideal for creative workshops, team brainstorming, innovation strategy, and agile process presentations. Fully editable in PowerPoint, Keynote, and Google Slides.
10 slides
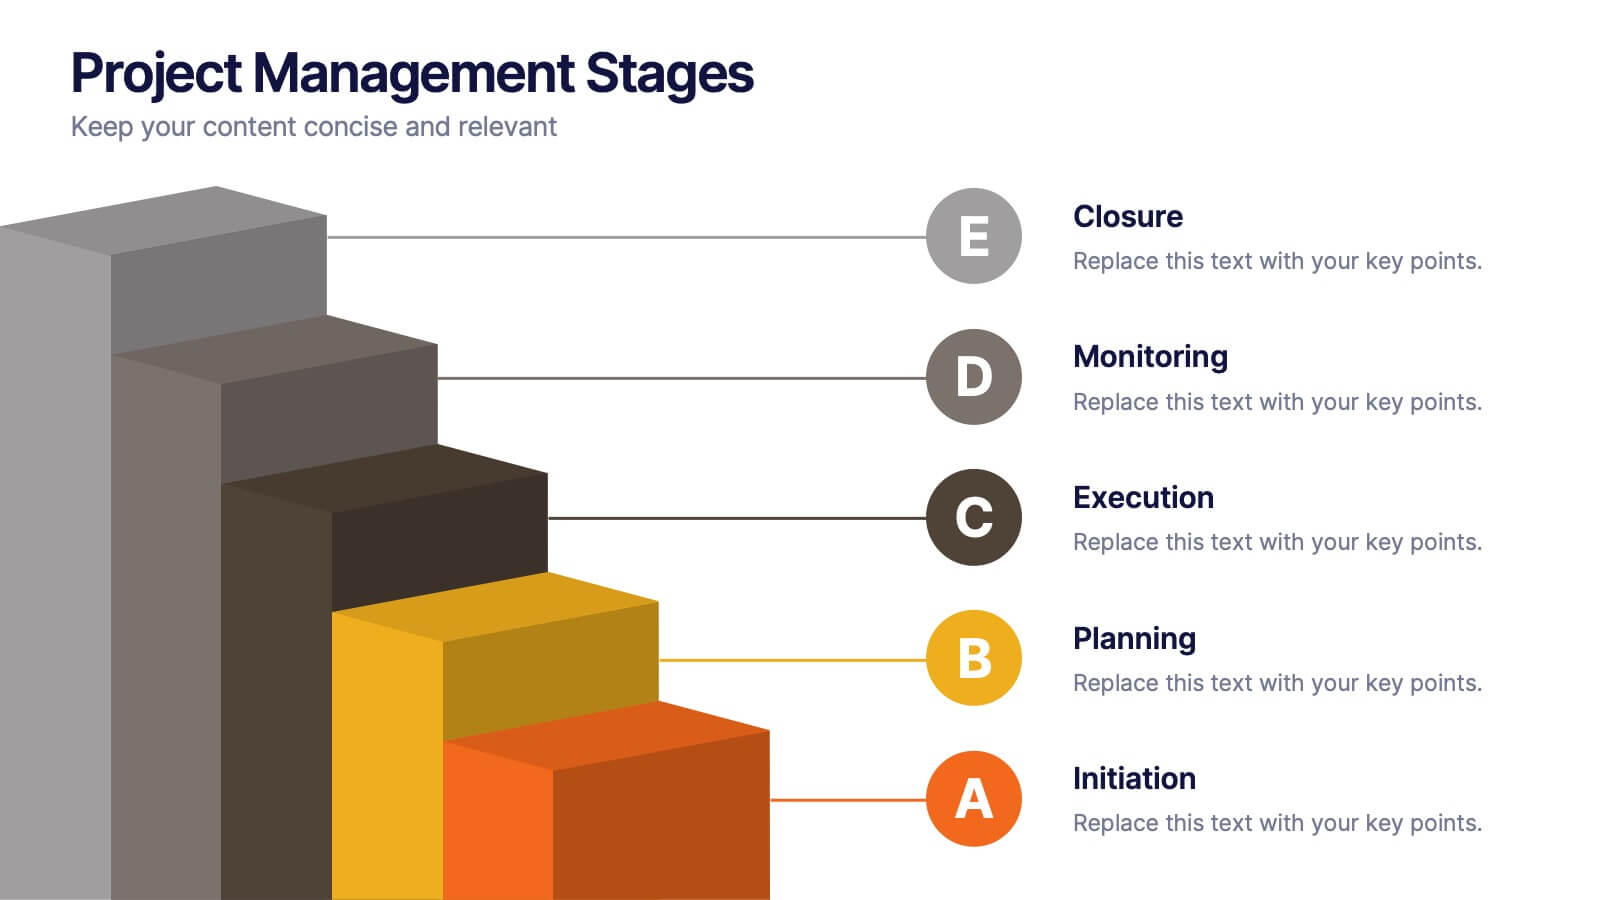
Project Management Stages
Master project management with our "Project Management Stages" template. This visually engaging presentation design effectively illustrates the project lifecycle across five key stages: Initiation, Planning, Execution, Monitoring, and Closure. Each stage is distinctively represented by a colored 3D block, visually stacked to highlight the progression and foundational importance of each phase. This clear, structured layout simplifies complex processes and emphasizes effective project management techniques. Ideal for project managers, team leaders, and educators, it serves as a vital tool for explaining workflows and responsibilities. Compatible with PowerPoint, Keynote, and Google Slides, this template is perfect for enhancing presentations on project planning and execution.
12 slides
Milestone Achievement Progress Map Presentation
Visualize progress with clarity using this dynamic Milestone Achievement Progress Map. Each slide combines bar charts and upward arrows to showcase key accomplishments, performance phases, or goal tracking. With three customizable titles and color-coded segments, this layout is perfect for project updates, strategy reviews, or performance recaps. Fully editable in PowerPoint, Keynote, and Google Slides.
9 slides
Business Dashboard Infographics
A business dashboard, often referred to as a business intelligence dashboard, is a visual representation of an organization's key performance indicators and critical business metrics. Empower your business analysis and strategy with our Infographic. This dynamic template enables you to present key business metrics, performance indicators, and trends in a clear and impactful manner. Compatible with Powerpoint, Keynote, and Google Slides. This template is a powerful tool to visualize your business progress, identify opportunities, and communicate your success story to viewers, clients, or team members.
4 slides
Real Estate Market Trends
Present housing data and property growth insights with this ascending building chart layout. Perfect for realtors, investors, and market analysts, this template helps visualize real estate performance over time. Fully editable in PowerPoint, Keynote, and Google Slides.
6 slides
Macro Environment PESTEL Framework
Navigate market forces with confidence using this dynamic PESTEL framework layout—designed to help you assess Political, Economic, Social, Technological, Environmental, and Legal factors with clarity. Whether for strategy planning or external analysis, this slide keeps your insights visually organized and easy to explain. Fully compatible with PowerPoint, Keynote, and Google Slides.
7 slides
Network Solutions Infographics
The Network Solutions Infographic is designed to showcase the complexities and interconnectivity of network systems in a clear, visual format. It is perfect for IT professionals, educators, and students to communicate the intricacies of network architecture, pathways, and protocols. This infographic can be tailored to highlight various network types, such as LAN, WAN, or VPN, and to illustrate the flow of data through different network layers and devices. It can also be used to explain concepts like network security, data management, and the impact of emerging technologies on networking. Whether used for training purposes, presentations, or as part of a marketing strategy for tech companies, the Network Solutions Infographic simplifies the transfer of detailed network information and engages the audience with its visual appeal.
6 slides
Work from Home Best Practices Presentation
The "Work from Home Best Practices" presentation template is thoughtfully designed to display metrics and insights for remote work effectiveness. Each slide provides visual elements like bar graphs, line charts, and icon grids to represent various data points such as weekly activity percentage, hours worked, and number of projects managed. This setup is ideal for illustrating best practices and benchmarks in remote work environments, enabling clear communication of goals, achievements, and areas for improvement. The template uses a clean and professional layout with plenty of space for customization, making it a versatile tool for remote teams looking to optimize their workflows and productivity.
8 slides
Virtual Team Collaboration Presentation
The "Virtual Team Collaboration" presentation template is designed to highlight different facets of teamwork in a remote setting. Each slide features a central visual metaphor illustrated by connected circles, symbolizing the interconnected nature of virtual team activities and communication. The layout provides placeholders for titles and descriptive text, making it suitable for detailing various aspects of virtual collaboration such as project management, communication protocols, and role assignments. The design encourages a clear and organized presentation of information, facilitating discussions on best practices and strategies for effective remote teamwork.
5 slides
Cloud Computing for Business Presentation
Present your cloud strategy with clarity using this modern five-point diagram. Each cloud icon is linked to a central device, symbolizing data flow, security, storage, and infrastructure services. Ideal for IT presentations, cloud migration plans, or SaaS workflows. Fully editable in PowerPoint, Keynote, and Google Slides.
6 slides
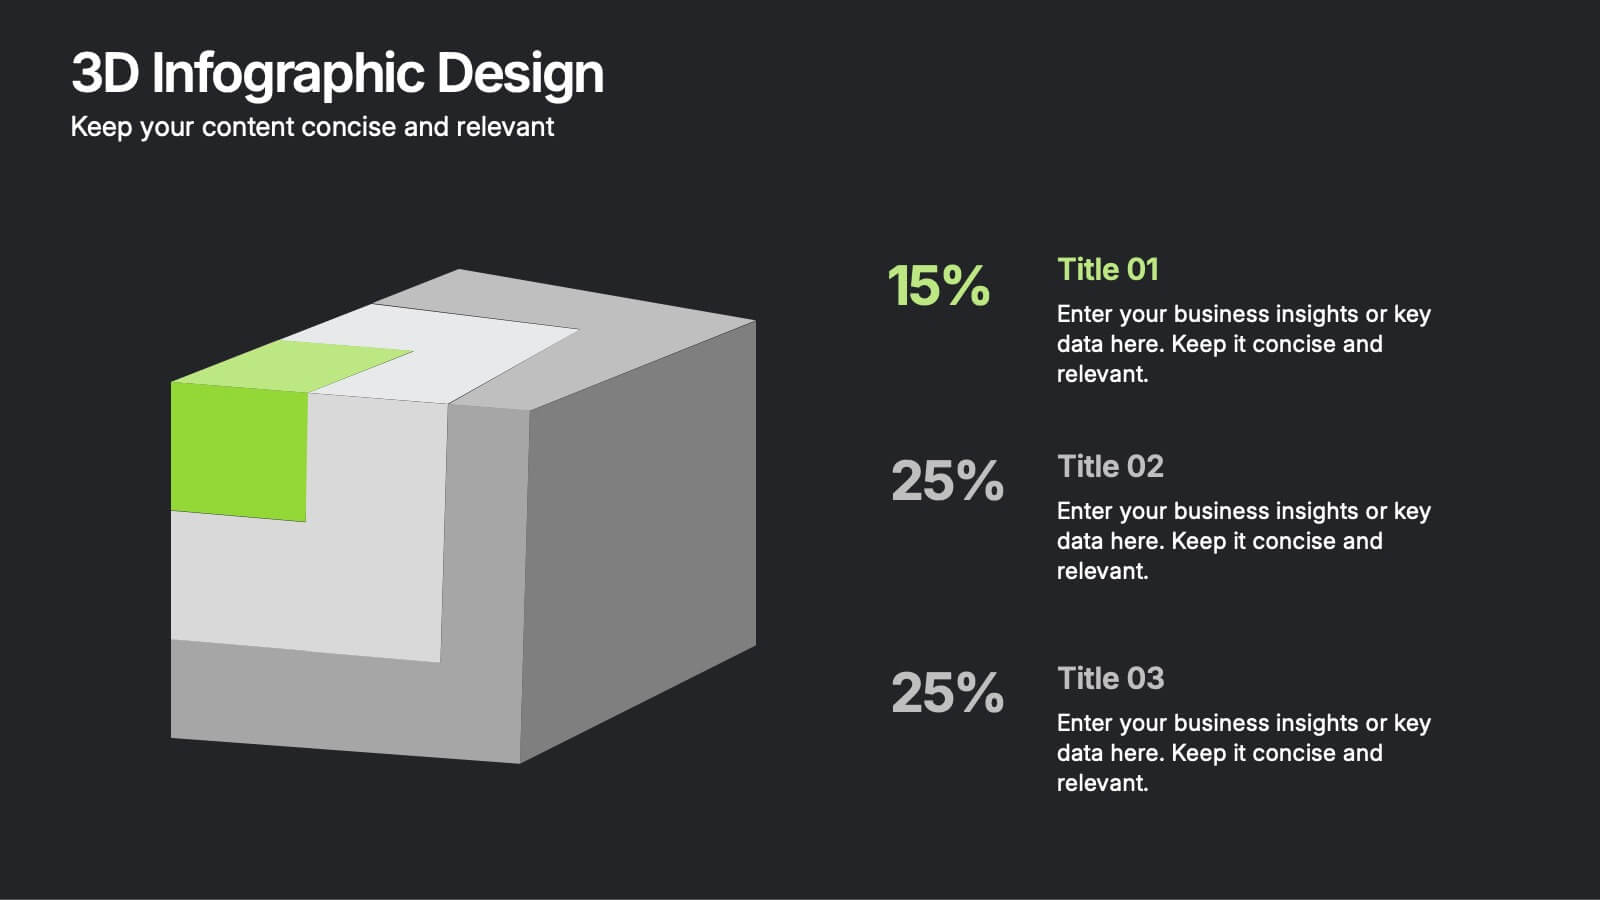
3D Infographic Design
Visualize data like never before with this bold 3D block diagram layout. Designed to break down complex figures into three key segments, it’s perfect for presenting percentages, growth areas, or metric comparisons. Easily editable in PowerPoint, Keynote, and Google Slides.
4 slides
Airline Industry Analysis and Growth Presentation
Navigate the future of aviation with the Airline Industry Analysis and Growth presentation. This template uses a dynamic runway visual to highlight four key metrics, trends, or milestones—ideal for tracking airline performance, market share, or industry forecasts. Best for aviation analysts, transport consultants, and business development teams. Fully editable in PowerPoint, Keynote, and Google Slides.


