Features
- 4 Unique slides
- Fully editable and easy to edit in Microsoft Powerpoint, Keynote and Google Slides
- Vertical widescreen layout
- Clean and professional designs
- Export to JPG, PDF or send by email
Recommend
5 slides
Global Market Trends World Map Presentation
Visualize your market insights with this sleek and professional Global Market Trends World Map slide. Designed to highlight key regional data with pinpoint accuracy, it’s ideal for presenting statistics, regional performance, or global expansion strategies. The sidebar gradient layout offers space for five categories, each linked to map locations. Fully customizable and compatible with PowerPoint, Keynote, and Google Slides.
8 slides
Workflow Diagram Presentation
The "Workflow Diagram Infographic" template is designed to clearly illustrate the sequence of tasks or stages within a project or business process. Each segment of the circular design is allocated for a specific phase, equipped with a title and descriptive area, and supported by distinct icons for quick identification. This layout is ideal for delineating task dependencies and operational sequences, helping to simplify and communicate complex procedures. It's particularly useful for project managers, operational leads, and trainers in explaining workflows and processes efficiently. This infographic serves as an effective visual tool for presentations aimed at streamlining discussions around process improvements and team alignments.
4 slides
Workplace Safety and Compliance Presentation
Ensure a safer work environment with our 'Workplace Safety and Compliance' presentation template. Perfect for illustrating essential safety protocols and compliance standards, this visual tool boosts understanding and adherence. Fully compatible with PowerPoint, Keynote, and Google Slides, it's an excellent resource for any safety-oriented presentation.
5 slides
Watercolor Background Design Presentation
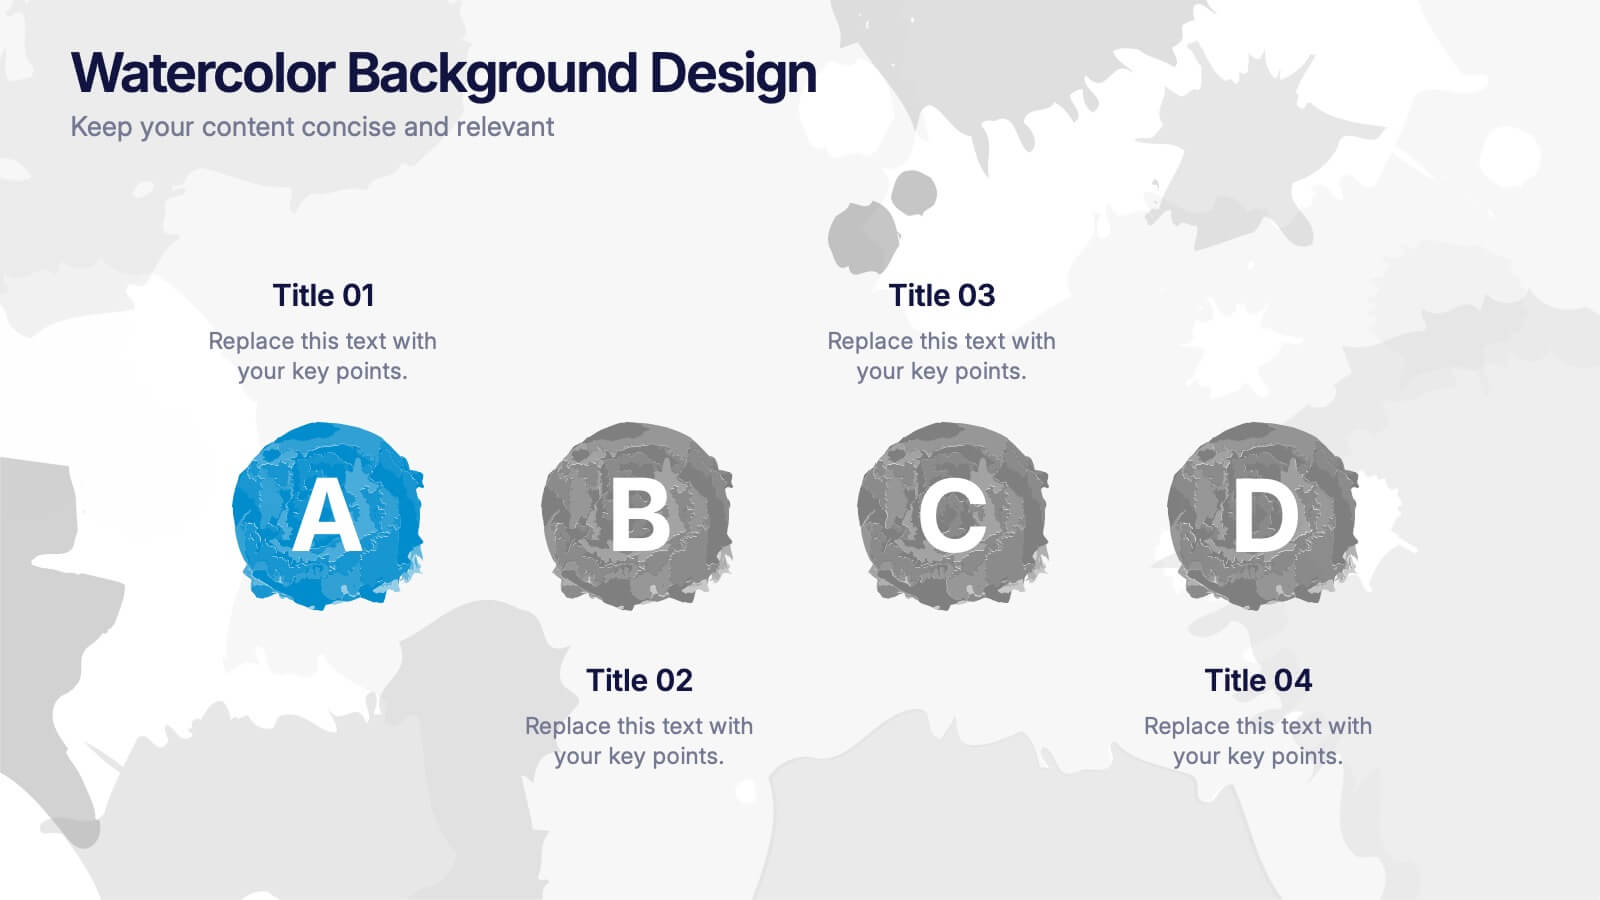
Add an artistic edge to your presentation with this Watercolor Background Design Template. Featuring soft, abstract paint splashes behind vibrant alphabet icons, it’s perfect for creative professionals, educators, or marketing teams looking to highlight four core ideas or comparisons. Fully editable in PowerPoint, Keynote, and Google Slides for a seamless customization experience.
7 slides
Mind Map Process Infographic
A Mind Map Process Infographic is a visual representation that illustrates a process or a series of steps using the structure and principles of a mind map. This template diagram is a dynamic visual guide to help individuals and teams harness the true potential of mind mapping. This is used to visually organize information in a hierarchical and interconnected manner, often starting with a central concept or theme and branching out into related ideas or subtopics. Mind maps are the ultimate tool for brainstorming, planning, and innovating, and this template is your gateway to unlocking their full potential.
5 slides
4-Phase Product Lifecycle Diagram Presentation
Visualize your product’s evolution with the 4-Phase Product Lifecycle Diagram Presentation. Perfect for marketing, strategy, and product teams, this template maps out introduction, growth, maturity, and decline stages. Fully editable in PowerPoint, Keynote, and Google Slides—ideal for product managers, analysts, and educators presenting strategic roadmaps or lifecycle planning.
5 slides
RAPID Decision-Making Model
Take the guesswork out of group decisions with this bold and clear template. It’s designed around the RAPID framework—Recommend, Agree, Perform, Input, Decide—to help teams define roles and make faster, more accountable choices. Perfect for leadership, strategy, and project planning sessions. Fully compatible with PowerPoint, Keynote, and Google Slides.
15 slides
Business Infographic Presentation Template
A business is an organization engaged in commercial, industrial, or professional activities. A Business Infographic is a visual representation of information related to business topics like marketing, sales, finance, project management, customer service, and more. Using the graphics, charts, icons, and other design elements provided, create the best presentation. These infographics are usually used to help explain business concepts, show trends and results, and communicate information to employees, stakeholders, customers, and for students. Use this for presentations, reports and websites!
6 slides
Measuring User Experience with Smile Ratings Presentation
Visualize customer sentiment with this Smile Rating UX slide. Featuring vertical smile meter graphics with corresponding percentages and descriptions, it’s ideal for product feedback, service evaluations, or usability reports. Clearly distinguish satisfaction levels across three stages or categories. Fully customizable in PowerPoint, Keynote, and Google Slides.
7 slides
Hospital Operations and Medical Services Presentation
Showcase hospital services, departments, or medical workflows with the Hospital Operations and Medical Services Presentation. Featuring a central hospital graphic with six surrounding icons, this slide is ideal for healthcare strategy, facility overviews, or operational planning. Easily editable in Canva, PowerPoint, Keynote, and Google Slides for versatile use in any healthcare setting.
6 slides
Shopping Pricing Tables Infographic
Pricing tables are visual tools commonly used on websites, product pages, and marketing materials to showcase different pricing options for products or services. This infographic template displays different pricing plans or packages offered by a business or service provider. This provides a clear comparison of features, benefits, and costs, helping viewers make informed decisions about which option best suits their needs and budget. This infographic is designed to help customers quickly compare features, costs, and benefits of each plan, aiding in their decision-making process. Compatible with Powerpoint, Keynote, and Google Slides.
5 slides
Target Audience Demographics
Present gender-based audience insights with this clean, dual-bar infographic slide. Ideal for showing comparative statistics between men and women across five demographic categories. Use this layout to support marketing analysis, campaign targeting, or consumer behavior reports. Editable in PowerPoint, Keynote, and Google Slides.
6 slides
Customer Journey Management Infographic
Map out the customer's path to purchase with our intuitive Customer Journey Management Infographic, perfect for Powerpoint, Google Slides, and Keynote. This visual tool helps businesses understand and enhance the customer experience at every touchpoint. Highlight critical stages from awareness to advocacy with distinct, easy-to-follow layouts. Customize it to fit your brand’s journey, showcasing the interactions and emotions customers encounter. Ideal for marketing strategy sessions and client presentations, it simplifies complex consumer behavior into a clear, actionable pathway.
8 slides
Cooperative Team Collaboration Strategy Presentation
Illustrate your teamwork dynamics with this interconnected diagram that visually represents synergy, communication flow, and shared responsibilities. Ideal for project planning, remote team updates, or stakeholder presentations. Fully editable in PowerPoint, Keynote, and Google Slides—adjust icons, colors, and text effortlessly to fit your narrative.
5 slides
Climate Change and Conservation Presentation
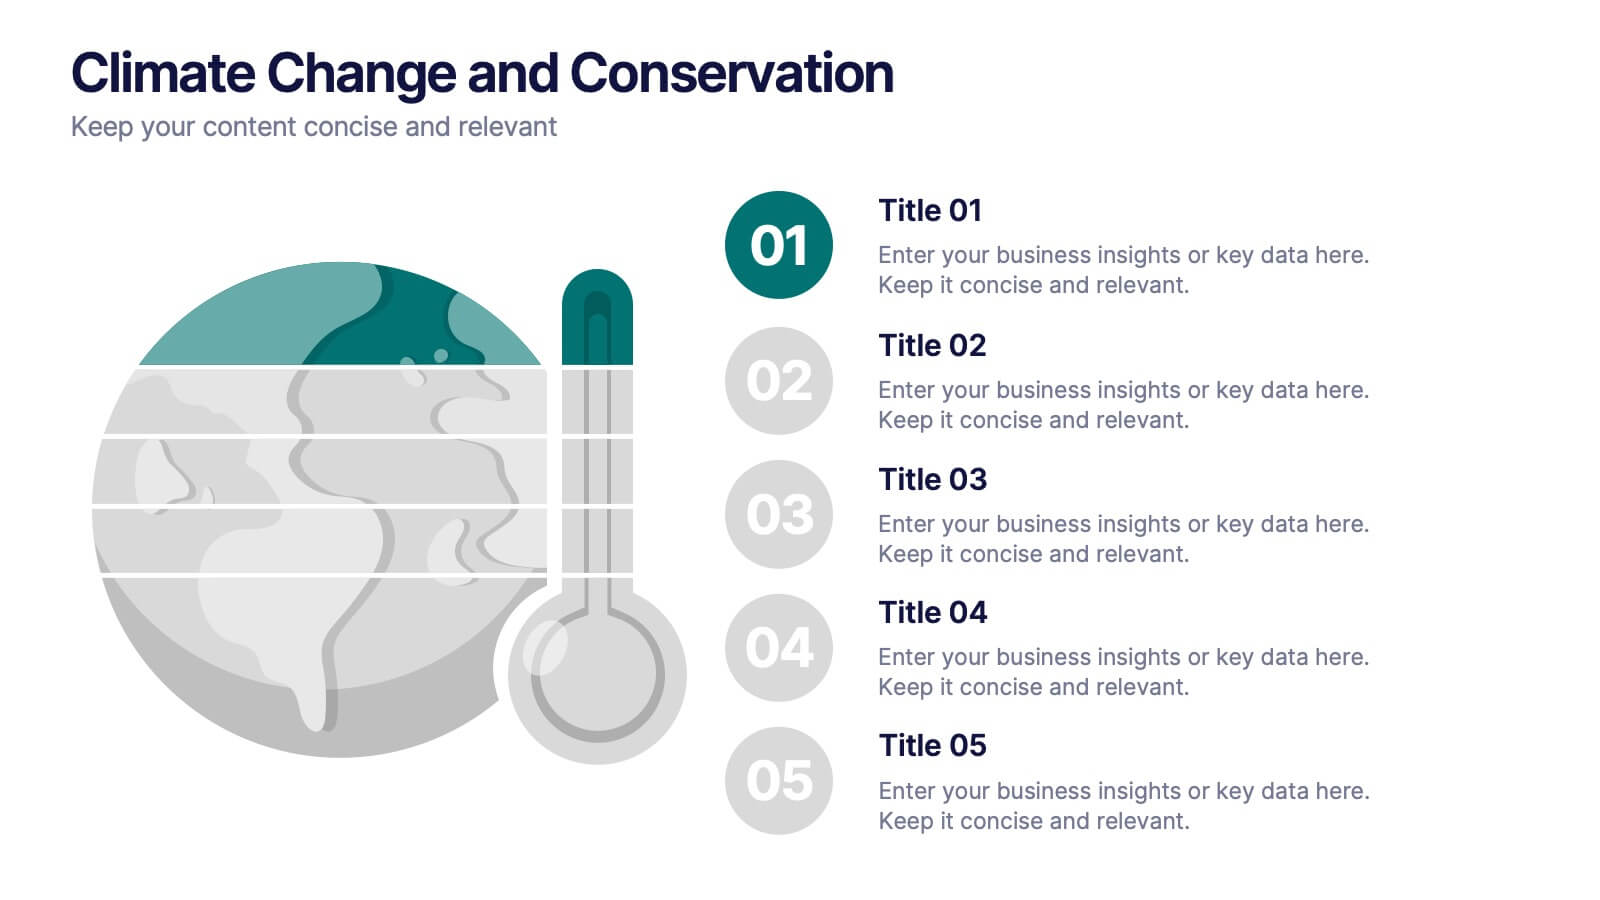
Make your message on climate action clear and compelling with this visually striking template. Featuring an impactful thermometer and globe graphic, this layout is perfect for showcasing key climate data, conservation efforts, and environmental goals. Each step is numbered and color-coded for easy storytelling and clarity. Ideal for NGOs, science educators, and sustainability advocates. Fully editable in PowerPoint, Keynote, and Google Slides.
4 slides
Problem-Solving Solution Framework Presentation
Streamline your approach to challenges with the Problem-Solving Solution Framework template, which visualizes complex solutions through an intuitive and clear design. It assists in entering business insights or key data in four structured sections, ensuring clarity and relevance. Ideal for strategic presentations, this template supports effective problem-solving narratives. Compatible with PowerPoint, Keynote, and Google Slides, it enhances presentation efficiency and impact.
6 slides
Circular Concept Diagram for Strategy Presentation
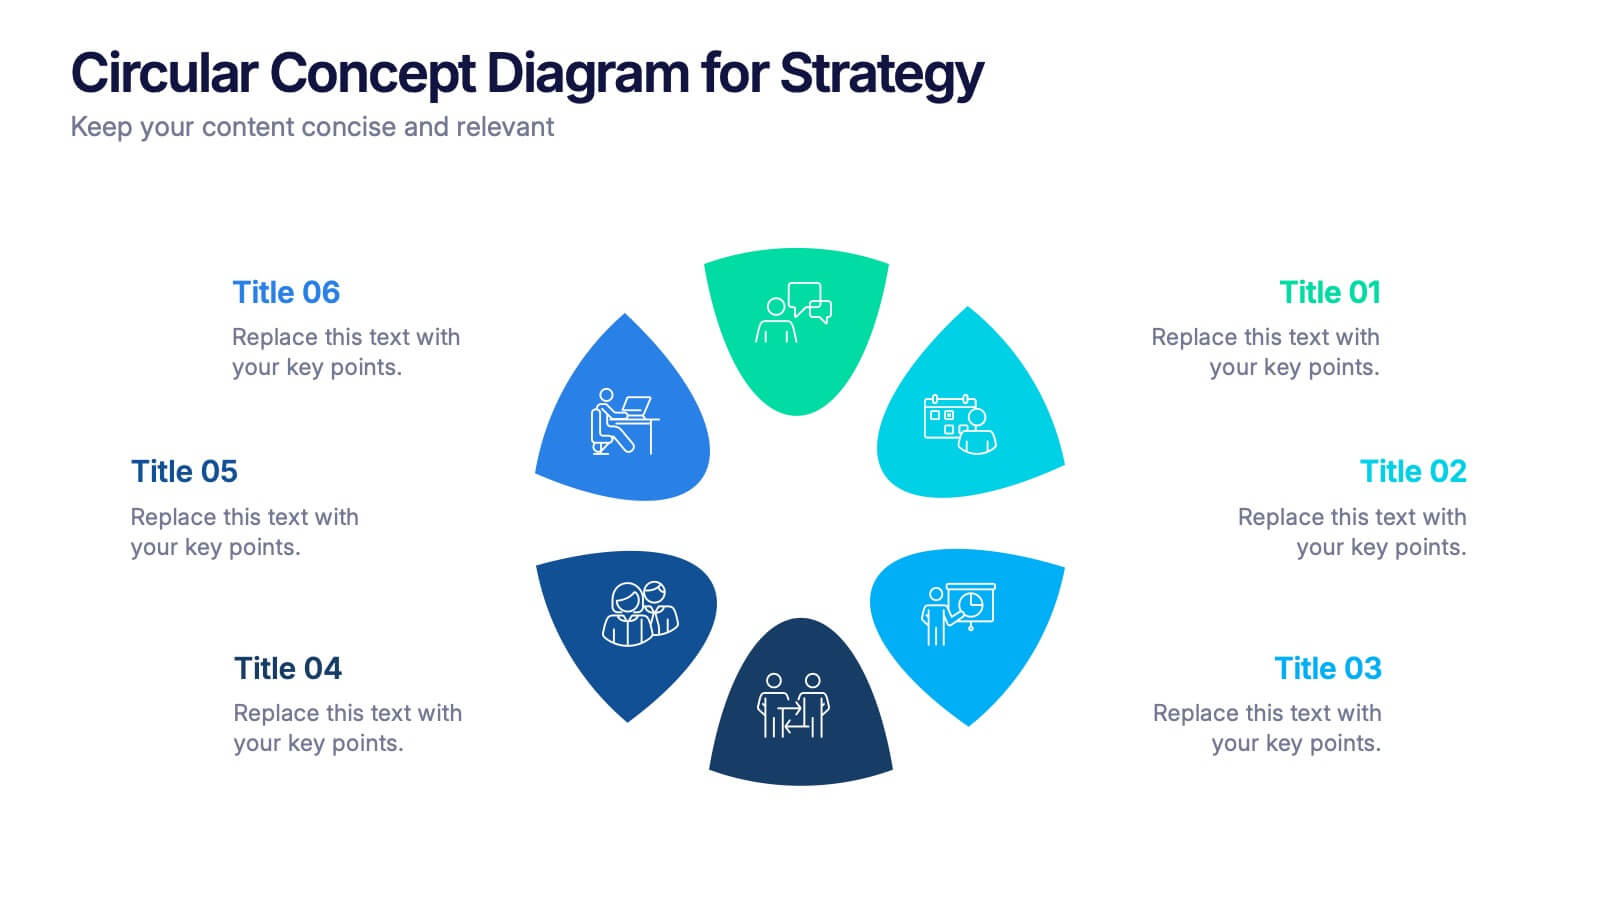
Visualize interconnected ideas with this circular concept diagram, ideal for showcasing six key strategic pillars or processes. Each segment is clearly labeled and icon-supported, creating an easy-to-follow layout. Perfect for business planning, marketing strategies, or organizational models. Compatible with PowerPoint, Keynote, and Google Slides for full customization.


