


Features
- 6 Unique Slides
- Fully editable and easy to edit in Microsoft Powerpoint, Keynote and Google Slides
- 16:9 widescreen layout
- Clean and professional designs
- Export to JPG, PDF or send by email


Do you have any questions?
Recommend


6 slides
Population Pyramid Infographic
A population pyramid, also known as an age-gender pyramid, is a graphical representation of the distribution of a population by age and gender. This infographic is a visually captivating presentation designed to illustrate the age and gender distribution of a population. It provides an easy-to-understand representation of the population structure, allowing viewers to grasp demographic patterns at a glance. Present your population data and demographic trends with this template. This enables viewers to grasp demographic patterns quickly and facilitates the key insights about a population's composition and changes over time.


22 slides
Vivid Market Research Presentation
Unveil the insights that drive decisions with the Vivid Market Research Presentation template! This sleek and professional template is crafted to help you present complex data in an engaging and easy-to-understand format. Whether you're analyzing market trends, exploring customer behavior, or evaluating competitive landscapes, this template provides a clear structure to convey your findings. It includes sections for research objectives, methodologies, key findings, and recommendations, ensuring you cover every aspect of your market research comprehensively. With a clean design that emphasizes clarity and visual appeal, your audience will stay focused and intrigued throughout the presentation. Perfect for business analysts, marketers, and researchers, the Vivid template is fully customizable and works seamlessly with PowerPoint, Keynote, and Google Slides. Elevate your market research presentations and make your data come to life with Vivid!


6 slides
Executive Summary of Findings Presentation
Summarize your key insights with clarity using this Executive Summary of Findings slide. Designed with a centered target icon and surrounding data points, it��s ideal for spotlighting major conclusions. Fully editable in PowerPoint, Keynote, and Google Slides.


6 slides
Smile Book Rating Infographics
Discover the captivating world of book ratings with Smile! This infographic is your gateway to understanding how to assess and rate books, offering insights into why and how to share your opinions effectively. Delve into the process of rating books with Smile, grasping the importance of thoughtful and honest ratings. Learn how your ratings contribute to helping fellow readers find their next favorite book and provide valuable support to authors. Explore the art of crafting detailed and constructive book reviews. Dive into the elements of a compelling review, covering aspects like plot, characters, and the moments that brought a smile (or provoked other emotions) while reading. Equip yourself with the skills to articulate your thoughts effectively. With this engaging infographic, compatible with PowerPoint, Keynote, and Google Slides, sharing your book ratings and reviews is a breeze. Empower yourself with the knowledge to become an influential book reviewer. Immerse yourself in the world of book ratings with Smile, embarking on a journey of literary exploration and appreciation.


21 slides
Somnara Full-Service Agency Project Plan Presentation
Present your agency��s expertise with a comprehensive project plan template designed to impress clients and stakeholders. This sleek and professional layout allows you to outline your mission and vision, highlight team strengths, and showcase core services with clarity. Use the client testimonials and case studies sections to establish credibility and trust. Visualize your strategic approach with dedicated slides for market analysis, creative process, and execution strategy. The template also includes detailed sections for partnership opportunities, social responsibility initiatives, and a future outlook, ensuring a holistic view of your agency��s capabilities and forward-thinking approach. Fully editable and compatible with PowerPoint, Google Slides, and Keynote, this template is perfect for full-service agencies seeking to elevate their presentations. Customize each slide to reflect your unique value and deliver impactful, results-oriented proposals.


6 slides
Corporate Sustainability Management Presentation
Step into the future of business with our Corporate Sustainability Management Presentation template. Perfect for strategists seeking to integrate eco-friendly practices, this template facilitates effective communication of sustainability goals and initiatives. It��s a powerful tool for illustrating how environmental strategies can be interwoven with business objectives to foster long-term growth. Tailored for presentations on PowerPoint, Keynote, and Google Slides, it helps leaders inspire action and commitment to sustainability across their organizations.


4 slides
3-Level Pyramid Diagram Presentation
Visualize priorities, strategies, or business structures with the 3-Level Pyramid Diagram Presentation. This slide design features a clear tiered layout��ideal for showcasing step-by-step processes, hierarchy levels, or goal-setting frameworks. Each level is color-coded for easy understanding, and the accompanying text areas keep messaging concise. Fully editable and compatible with PowerPoint, Keynote, and Google Slides.


5 slides
Identifying Core Issues with Cause Mapping Presentation
Pinpoint the origin of your challenges with the Identifying Core Issues with Cause Mapping Presentation. This diagram is designed to break down problems step-by-step using a clean, logical flow format. Ideal for root cause analysis, risk reviews, and strategic audits, it helps teams visualize contributing factors and map out relationships. Fully editable in PowerPoint, Keynote, and Google Slides.


5 slides
Supply Chain Industry Infographics
The supply chain industry refers to the network of organizations, resources, activities, and technologies involved in the production, distribution, and delivery of goods and services from the point of origin to the point of consumption. These vertical infographics encompasses all the stages and processes involved in the movement of products, including procurement, manufacturing, logistics, and customer service. These are designed to help your audience understand the intricacies of supply chain management and its role in business operations. Compatible with Powerpoint, Keynote, and Google Slides.


7 slides
McKinsey 7S Model Infographic Presentation Template
The McKinsey 7S model is a management framework developed by the consulting firm McKinsey & Company. The model consists of seven interdependent factors that are important for an organization's success: strategy, structure, systems, shared values, skills, staff, and style. The template can be used to visualize the 7S model hierarchy and the importance of each component to your business. This inventive presentation is designed to take an economic approach, If you��re interested in taking this strategic step to evaluating your processes and measuring performance, this presentation is for you.


10 slides
Modern Healthcare Technology Trends Presentation
Highlight innovations in healthcare with the Modern Healthcare Technology Trends Presentation. This slide features a central device graphic connected to four key icons, perfect for showcasing digital tools, emerging trends, or medical tech strategies. Fully customizable in Canva, PowerPoint, Keynote, and Google Slides��ideal for medical tech briefings and strategic presentations.


7 slides
Mind Map Infographic Presentation Template
A mind map is a diagram that allows you to visualize how related ideas and concepts are connected to one another. It is especially good for brainstorming, planning and organizing. A mind map allows you to organize information in a way that shows your thinking process and gives you the opportunity for deeper understanding. This template will help others understand how you think about a particular subject or topic. Use this template to "brainstorm" a topic, and create an interesting mind map. You can also use it to share your ideas with others, or to visually organize your thoughts.


6 slides
Project Milestone and Status Update Presentation
Clearly communicate progress at every project phase with the Project Milestone and Status Update presentation slide. This table-style layout visually breaks down percentage completion across five key stages��Initiation, Planning, Execution, Monitoring, and Closing��making it ideal for status meetings, project reviews, or executive reports. Color-coded for easy reference and fully customizable in PowerPoint, Keynote, and Google Slides.


5 slides
Social Distancing and Workplace Safety Presentation
Promote safety in the workplace with this modern and approachable slide layout. Designed around a central illustration of a masked employee at a desk, the slide includes four surrounding text areas with icons to highlight policies, procedures, or key reminders. Perfect for health protocols, return-to-office plans, or HR briefings. Fully editable in PowerPoint, Keynote, and Google Slides.


6 slides
3D Shapes Infographic
3D shapes, also known as three-dimensional shapes or solids, are geometric figures that have three dimensions: length, width, and height (or depth). This Infographic visually explains various three-dimensional geometric shapes, their properties, and real-world applications. With this template you can summarize the benefits of the 3D Shapes in simplifying the understanding of complex shapes and encouraging practical applications in various fields. This infographic is the perfect study aid for students preparing for geometry exams. This is fully customizable and compatible with Powerpoint, Keynote, and Google Slides.


20 slides
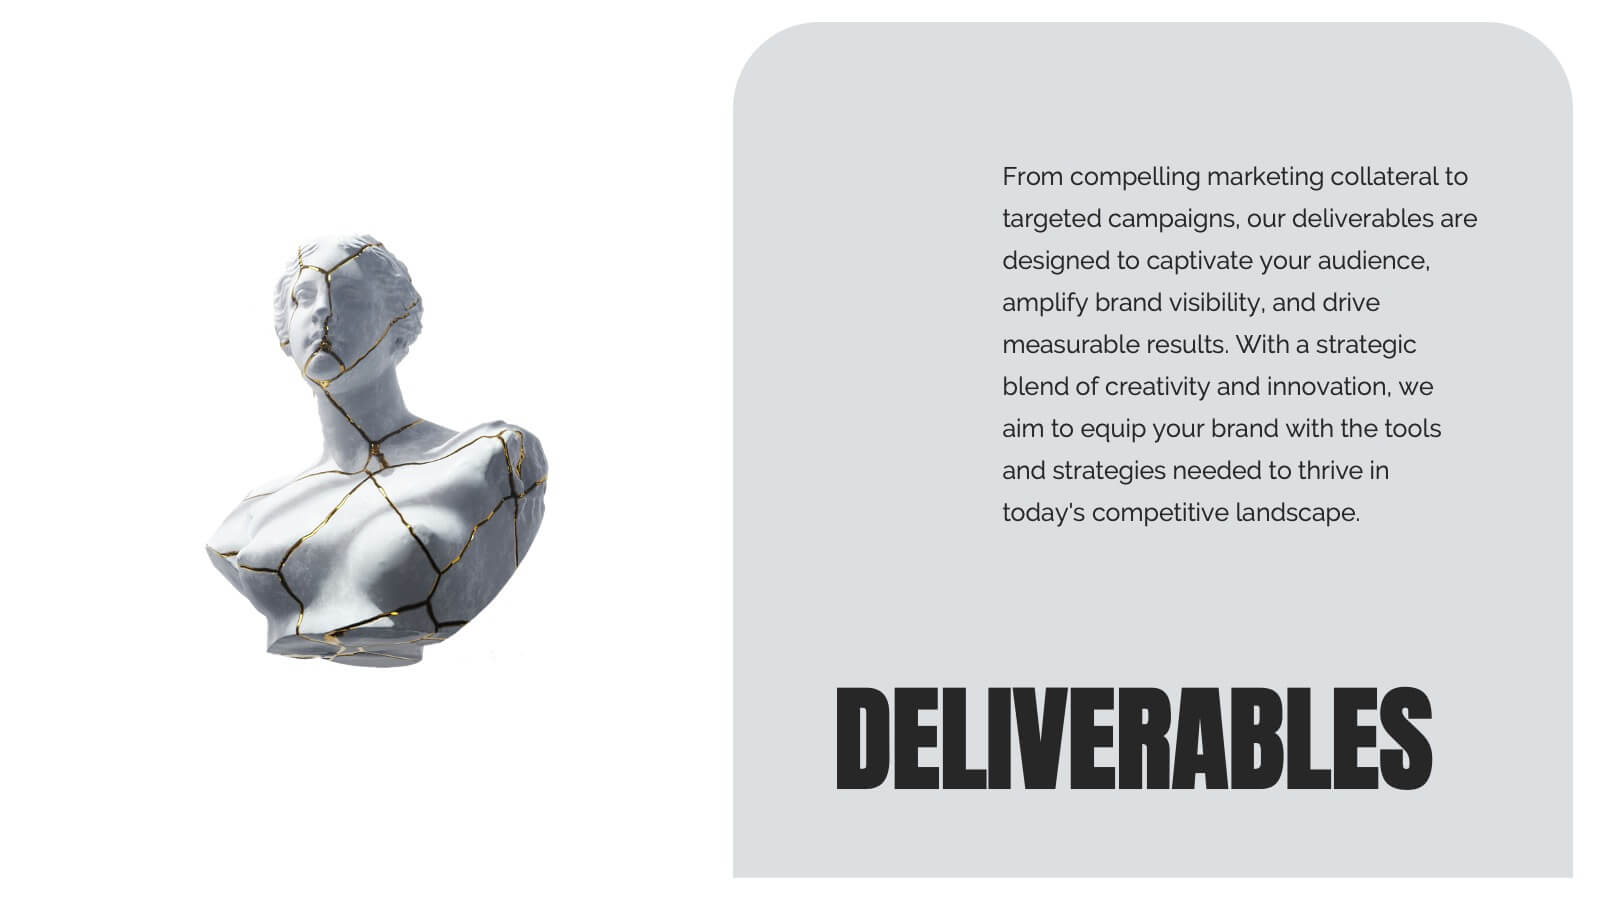
Venus Design Proposal Presentation
Present your design proposal with confidence using this sleek and professional layout! It includes everything from problem statements and proposed solutions to budget breakdowns, milestones, and team expertise, ensuring every detail is covered. Ideal for client presentations or internal project pitches, this template is fully compatible with PowerPoint, Keynote, and Google Slides.


7 slides
Decision Steps Infographic
Decision-making is a pivotal aspect of any business journey. This decision steps infographic, designed in a harmonious blend of green, white, and blue, effortlessly maps out the complexity of such decisions. It offers a structured, graphical representation of the pathways that lead to informed choices. Executives, project managers, and team leaders will find this tool indispensable when guiding teams and stakeholders through the labyrinth of options. Enhanced to work seamlessly on PowerPoint, Keynote, and Google Slides, this infographic stands as a beacon for those navigating the multifaceted terrains of business decisions.