


Features
- 2 Unique slides
- Fully editable and easy to edit in Microsoft Powerpoint, Keynote and Google Slides
- 16:9 widescreen layout
- Clean and professional designs
- Export to JPG, PDF or send by email


Do you have any questions?
Recommend


7 slides
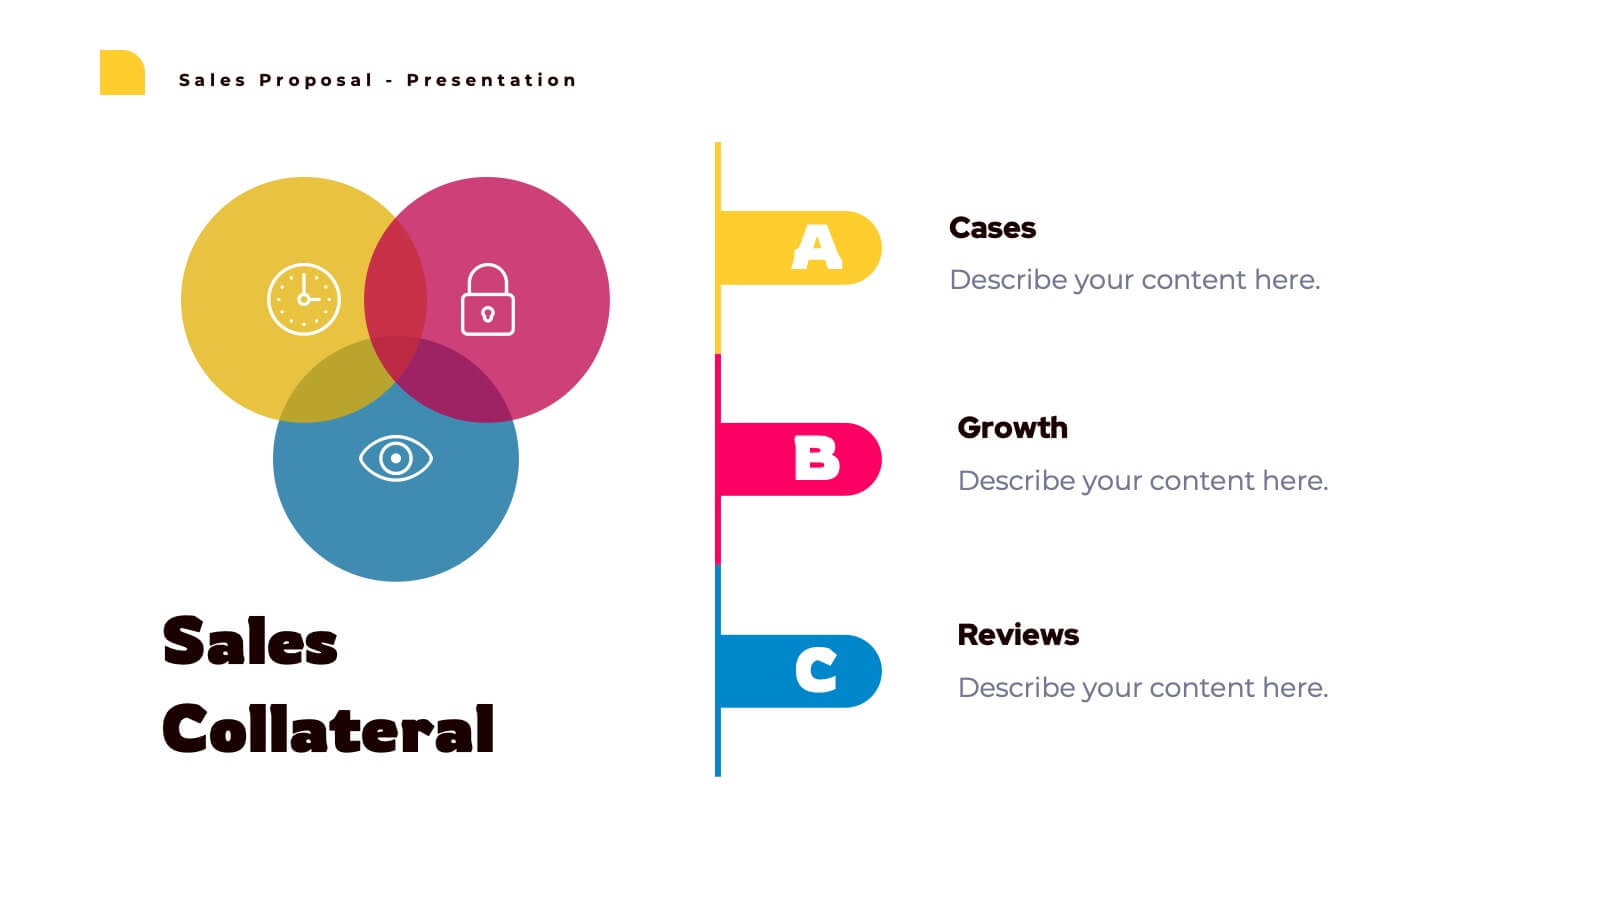
Union Venn Diagram Infographic
Venn Diagrams are a great way to display your data in an organized, aesthetically pleasing way. This infographic template is perfect for any presentation that requires a Venn Diagram. This template is designed to visually demonstrate the impact of your company's efforts. Use this to show how different teams work to achieve goals, or how different departments work together to create something new. Compatible with Powerpoint, Keynote, and Google Slides. This infographic uses a cool, bold color scheme and fun imagery to show the relationship between two or more sets of data in a way that will help you easily explain it to your target audience.


6 slides
Market Differentiation with Blue Ocean Strategy Presentation
Set your brand apart with our Market Differentiation with Blue Ocean Strategy template. This visually compelling tool helps you chart a course through uncharted business waters, emphasizing innovation in cost management, value creation, and buyer engagement. Compatible with PowerPoint, Keynote, and Google Slides, it��s perfect for presenting strategic insights that escape the competitive red ocean into the clear, blue waters of uncontested market space.


6 slides
Audience Targeting and Segmentation
Get to know your audience like never before with this human-centered visual layout��ideal for mapping out key segments, demographics, and targeting strategies. Great for marketing plans, user personas, or customer insights presentations, this slide keeps your data visually focused and easy to digest. Fully compatible with PowerPoint, Keynote, and Google Slides.


5 slides
Clear Strategy in Five Stages Presentation
Outline your strategic roadmap with this five-step cube staircase layout. Perfect for planning, growth tracking, or project milestones, each stage is color-coded with icons and numbered steps for clarity. Easy to edit in PowerPoint, Keynote, and Google Slides��ideal for business planning, strategy sessions, or performance reviews.


7 slides
Science Research Infographic
Science research, is a systematic and organized inquiry that aims to generate new knowledge, validate existing knowledge, or solve specific problems using scientific methods and principles. This infographic template aims to present your science research initiatives, achievements, and vision to the audience in an engaging and informative way. This is essential to convey complex scientific data and discoveries in a visually appealing manner. Fully customizable and compatible with Powerpoint, Keynote, and Google Slides. Adapt and personalize the content to align with your specific research center's focus and mission.


7 slides
Geometric Series Infographic
Geometric series have various applications in mathematics, physics, engineering, economics, and other fields. Get ready for a joyful expedition into the world of numbers, shapes, and patterns with our geometric series infographic. This template is a celebration of mathematical elegance, presented with a burst of enthusiasm to make learning a delightful adventure. This is fully customizable and compatible with Powerpoint, Keynote, and Google Slides. This allows you to paint a vivid picture by relating geometric series to real-life scenarios. Showcase how these mathematical visuals resonates in unexpected places.


4 slides
Budget Projection with Predictive Analysis Presentation
Visualize future financial outcomes with clarity using the Budget Projection with Predictive Analysis Presentation. This modern funnel-style layout helps break down key stages of budget forecasting, making it easy to communicate progressions and data-driven insights. Perfect for financial planning, reporting, or strategic reviews. Fully editable in PowerPoint, Google Slides, Keynote, and Canva.


6 slides
Engagement Survey Results Infographics
Effectively communicate your engagement survey results with our Engagement Survey Results infographic template. This template is fully compatible with popular presentation software like PowerPoint, Keynote, and Google Slides, allowing you to easily customize it to illustrate and convey your survey findings. The Engagement Survey Results infographic template offers a visually engaging platform to present survey data, key findings, and insights related to employee or customer engagement. Whether you're an HR professional, manager, or business leader, this template provides a user-friendly canvas to create informative presentations and reports on engagement survey outcomes. Optimize your communication of survey results with this SEO-optimized Engagement Survey Results infographic template, thoughtfully designed for clarity and ease of use. Customize it to showcase survey methodology, response rates, visualizations of data, and action plans based on the findings, ensuring that your audience gains a comprehensive understanding of the survey results and their implications. Start crafting your personalized infographic today to effectively communicate engagement survey outcomes.


5 slides
Pet Care Infographics
Pet care refers to the practices and actions taken to ensure the well-being, health, and happiness of pets. These vertical infographic templates are perfect for providing essential information and tips for pet owners to ensure the well-being and proper care of their furry companions. This infographic is designed to present key aspects of pet care in a concise and engaging manner, making it a valuable resource for pet owners, veterinarians, pet stores, or any organization related to pet care. Compatible with Powerpoint, Keynote, and Google Slides. Use the text boxes and graphs to promote responsible pet ownership and provide valuable information about pet care.


8 slides
Team Statistics and Rankings Presentation
Showcase match performance, rankings, and team metrics with this Team Statistics and Rankings Presentation. Visualize key game stats using editable diagrams, heatmaps, and comparison scores. Perfect for sports analysts, coaches, or recap slides. Compatible with PowerPoint, Keynote, and Google Slides��fully customizable for your team��s specific data and branding needs.


5 slides
Cyber Security Statistics Infographics
Cybersecurity refers to the practice of protecting computer systems, networks, and digital information from unauthorized access, data breaches, theft, or damage. These infographic templates are designed to help educate and raise awareness about the importance of protecting digital assets and staying vigilant against cyber threats. They allow you to effectively communicate the significance of cybersecurity through cyber icons and compelling statistics. This is useful for organizations, educational institutions, and individuals who want to promote awareness and encourage proactive measures to protect against cyber threats.


5 slides
Contracts and Law Capacity Infographics
In the context of contracts and law, "capacity" refers to a person's legal ability to enter into a contract and be bound by its terms. These colorful infographics are designed to simplify the complex concepts of contracts and law capacity for the audience. This infographic template aims to provide essential information about the legal aspects of contracts and the concept of capacity in a visually appealing manner. This section provides a clear definition of contracts and highlights the essential elements. The template incorporates engaging infographics, icons, and illustrations to visualize key concepts and make the information more memorable.


6 slides
McKinsey 7S Framework
Visualize the interdependent elements of organizational success with this professional McKinsey 7S Framework template. Ideal for strategic planning, change management, or internal assessments, this editable slide highlights structure, systems, style, staff, skills, strategy, and shared values. Fully compatible with PowerPoint, Keynote, and Google Slides.


5 slides
Visionary Leadership Models in Business
Illustrate transformative leadership approaches with the Visionary Leadership Models in Business Presentation. This slide features a central vertical timeline with bold icons and text areas that highlight four key principles or stages of leadership. Ideal for strategy sessions, keynote addresses, or leadership training programs. Fully compatible with PowerPoint, Keynote, and Google Slides.


21 slides
Lunaris Sales Proposal Presentation
An engaging and professional presentation designed to showcase sales proposals effectively. It features slides for objectives, market analysis, pricing strategies, team introductions, and performance metrics. The vibrant design ensures impactful communication with stakeholders. Fully editable and compatible with PowerPoint, Keynote, and Google Slides for seamless customization and presentation delivery.


6 slides
Iceberg Business Infographic
Delve beneath the surface with our Iceberg Business Infographic, perfect for Powerpoint, Google Slides, and Keynote. This infographic is designed to illustrate the underlying factors that impact an organization's success. The iceberg metaphor visually represents the concept that only a small part of a company's situation is visible above the surface, while much more is hidden below. The customizable segments can be used to detail various aspects of business operations, risks, and opportunities that are not immediately apparent. By employing this Iceberg Business infographic, you can effectively communicate the complexities of business strategies.


12 slides
Social and Professional Networking Presentation
Build Strong Connections with this Social and Professional Networking template. Featuring a dynamic network diagram, this slide helps visualize connections, relationships, and networking strategies in a clean, professional format. Ideal for business professionals, marketers, and career coaches, this fully editable template is compatible with PowerPoint, Keynote, and Google Slides for seamless customization.