


Features
- 4 Unique Slides
- Fully editable and easy to edit in Microsoft Powerpoint, Keynote and Google Slides
- 16:9 widescreen layout
- Clean and professional designs
- Export to JPG, PDF or send by email


Do you have any questions?
Recommend


7 slides
Work From Home Infographic Presentation Template
A Work From Home Infographic is a visual representation of data related to working from home. This infographic can be used as a guide to get you through some of the best opportunities available. Use this template to get the necessary tools to start working from home. Use this infographic to show your audience how many people work from home by adding statistics, tips and interesting facts. This template is designed to effectively communicate complex information in a simple format, making it great for exploring the topic of working from home. This is a perfect way to promote your business!


6 slides
TAM SAM SOM for Target Reach Forecasting Presentation
Break down your market reach with clarity using the TAM SAM SOM for Target Reach Forecasting Presentation. This sleek, layered circle diagram is ideal for illustrating your total addressable market, serviceable market, and obtainable market. Customize easily in PowerPoint, Keynote, or Google Slides to align with your brand and business strategy.


8 slides
Geometric Design Elements Presentation
The "Geometric Design Elements" presentation template features a modern layout utilizing geometric shapes to organize and present data effectively. Each slide provides a unique configuration of circles or connected shapes, facilitating clear visualization of interconnected topics or categories. These design elements are ideal for displaying business insights, relationships between concepts, or summarizing key points in a visually appealing and easily digestible format. The use of varied colors helps to distinguish between different sections or ideas, enhancing the viewer's ability to follow and absorb the presented information efficiently. This template is suitable for business presentations that require a balance of aesthetic appeal and functional design to communicate complex information clearly.


5 slides
End-to-End Process Flow Framework Presentation
Visualize your operations from start to finish with the End-to-End Process Flow Framework Presentation. This clean, arrow-based layout is perfect for outlining workflows, project stages, or business processes step by step. Fully customizable in Canva, PowerPoint, and Google Slides to suit any team or strategic need.


6 slides
First-Time Buyer Tips Infographic
Navigate the thrilling world of first-time purchases with our "First Time Buyer Tips" Infographic Template. This vibrant tool is crafted to guide newcomers through the buying process with clarity and confidence. Each slide is a step-by-step beacon, illuminating the path with expert advice, from understanding budgeting basics to mastering negotiation tactics. Designed with the novice buyer in mind, this template features a series of easy-to-follow visuals and succinct tips that demystify the complexities of making major purchases. The clean, engaging design ensures that each piece of advice is both accessible and memorable, ideal for personal finance websites, real estate blogs, or consumer education workshops. Customize the color schemes, fonts, and layouts to align with your branding, making it a seamless addition to your educational materials. Equip your audience with the knowledge they need to make informed, confident decisions with this indispensable guide.


10 slides
Lean Six Sigma Business Strategy Presentation
Enhance your operational efficiency with our Lean Six Sigma Business Strategy template! This user-friendly guide helps you navigate through the core stages��Define, Measure, Analyze, Improve, and Control��optimizing processes and reducing waste. Compatible with PowerPoint, Keynote, and Google Slides, this template is perfect for professionals aiming to drive business excellence through structured problem-solving.


6 slides
Regional Finance Infographic
Regional finance plays a vital role in fostering economic growth, attracting investments, and improving the overall well-being of communities within a specific region. This infographic template focuses on financial trends, insights, and data related to specific regions or countries. It is designed to help businesses, organizations, or financial professionals analyze and understand the financial landscape of a particular region. The data-driven content in this template is suitable for businesses or individuals seeking insights to make informed decisions regarding investments, market entry, or financial planning in a specific region.


10 slides
Risk Management Plan Presentation
The "Risk Management Plan Presentation" template is designed to outline strategic steps for identifying, assessing, managing, and monitoring business risks. Each segment of the plan is clearly labeled and represented on a segmented wheel, with A identifying risks, B assessing them, C managing responses, and D monitoring and reporting outcomes. The clean and straightforward design ensures key risk management strategies are communicated effectively to stakeholders. This visual tool is perfect for business meetings or training sessions, helping teams understand their roles in mitigating risks and ensuring that the business maintains a proactive approach to challenges.


5 slides
Ecological Impact Reduction Strategies Presentation
Present your sustainability efforts with the Ecological Impact Reduction Strategies Presentation. This tree-inspired layout is perfect for outlining key eco-friendly initiatives, from waste management to energy efficiency. Clean visuals and editable elements make it easy to adapt for environmental proposals, reports, or team planning. Fully customizable in Canva, PowerPoint, or Google Slides.


5 slides
Annual Business Performance Year in Review Presentation
Present your metrics with clarity using the Annual Business Performance Year in Review Presentation. This visual slide showcases key data points and financial highlights through an ascending, step-based layout �� perfect for reflecting growth, comparing yearly results, or visualizing KPIs. Ideal for year-end reviews or stakeholder updates. Easy to edit and compatible with PowerPoint, Keynote, and Google Slides.


20 slides
Dreamora Sales Performance Report Presentation
Deliver an impactful overview of your sales performance with this sleek and vibrant template. It features sections to highlight key aspects such as sales metrics, team introductions, and competitive analysis, ensuring a comprehensive presentation of your achievements and strategies. The template includes dedicated slides for sales objectives, customer testimonials, and pricing strategy, allowing you to showcase your results and future opportunities with clarity. Use the feedback and closing summary slides to leave a lasting impression on your audience. Fully customizable and compatible with PowerPoint, Google Slides, and Keynote, this template is ideal for sales teams, business leaders, and marketers who want to present performance metrics with professionalism and style.


21 slides
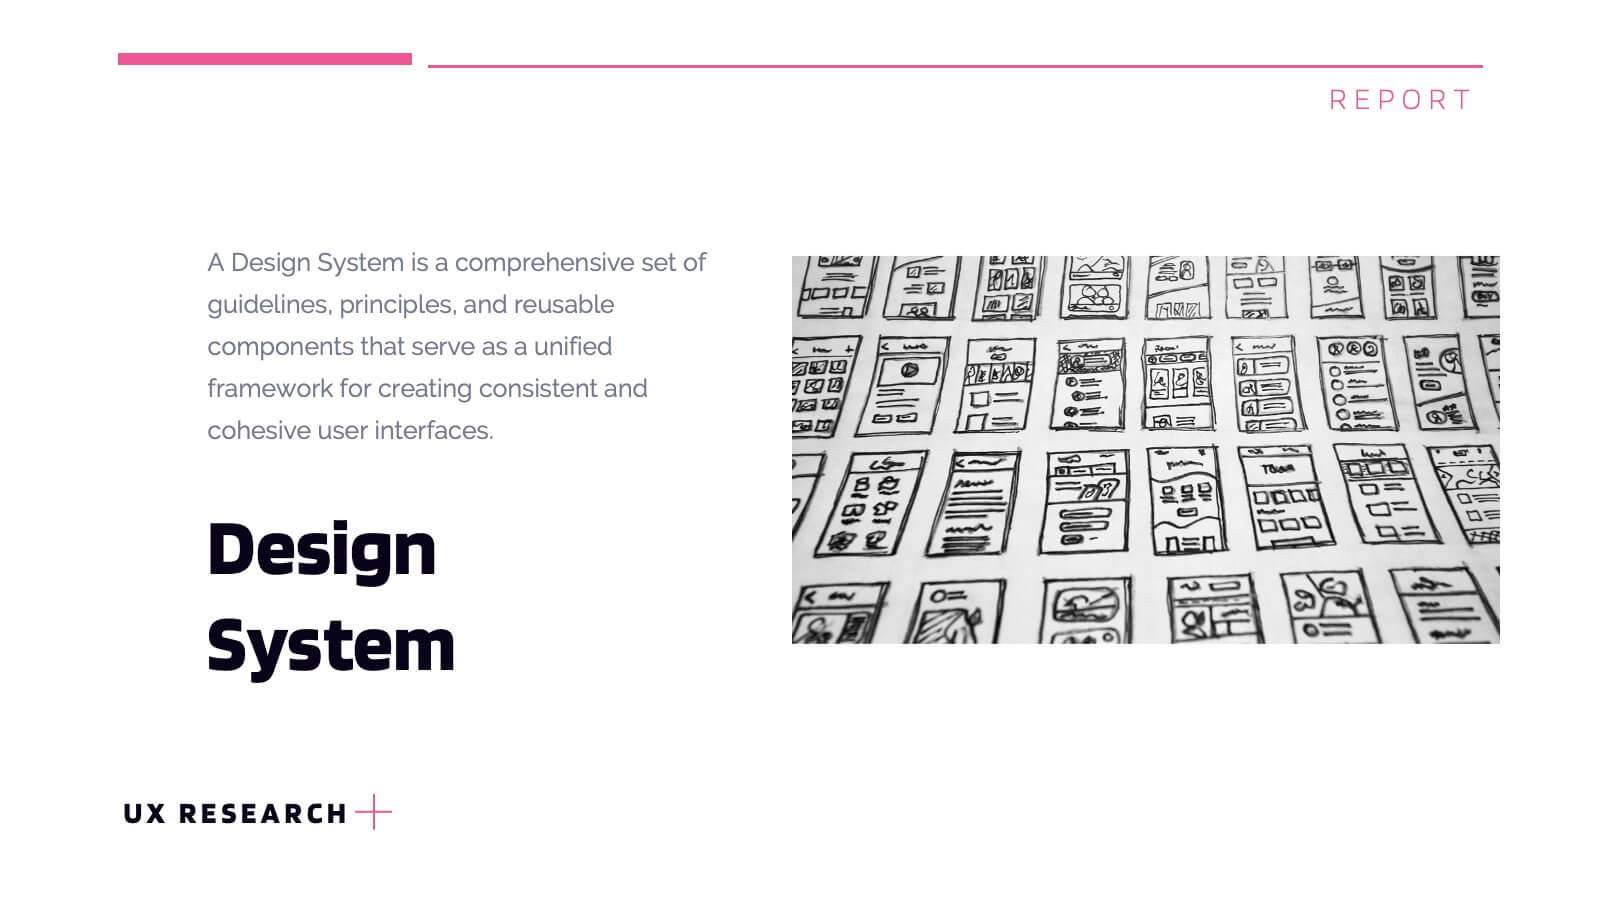
Lumascend UX Research Report Presentation
Present your UX research findings with clarity using this engaging and organized template! Covering key areas like user personas, wireframes, testing, and interaction design, it ensures all aspects of your design process are communicated effectively. Perfect for UX teams, stakeholders, or client presentations, this template works seamlessly with PowerPoint, Keynote, and Google Slides.


5 slides
Vegan Guide Infographics
A Vegan Guide is a comprehensive resource that provides information about a plant-based diet that excludes all animal products, including meat, dairy, eggs, and honey. These Vegan Guide Infographics are visual representations of information related to the vegan lifestyle. Cover a wide range of topics, including the benefits of veganism, how to transition to a vegan diet, common misconceptions about veganism, ethical and environmental considerations, and the nutritional requirements of a vegan diet. This can be used by individuals who are interested in adopting a vegan lifestyle, and educators who want to provide information about veganism to their clients and students.


7 slides
Company Structure Infographic
Company structure, often referred to as organizational structure, outlines how a company is organized in terms of hierarchy, roles, responsibilities, and the flow of information. Discover the inner workings of your organization with our Company Structure Infographic. This visually captivating and informative infographic serves as a guide to understanding the hierarchical layout, roles, and relationships within your company. Compatible with Powerpoint, Keynote, and Google Slides. Illustrate the structure levels within the company, showcasing the roles and responsibilities at each level and how they contribute to the company's success.


7 slides
Artificial Intelligence Presentation Template
An Artificial Intelligence infographic is a visual representation of information related to AI. This high-definition infographic is completely customizable and will allow you to see advances in AI and other networks. Artificial Intelligence, is evolving rapidly. It's important that we understand what's going on so that we can ensure the future of this technology is beneficial to society. In this informative infographic, you will be able to learn and inform about everything from the difference between artificial intelligence and the differences between expert systems by adding you own data.


5 slides
History of Photography Infographics
The History of Photography traces back to the early 19th century when the concept of capturing and preserving images through a camera was first realized. These infographic templates provide a visually stunning format to showcase the key milestones, influential photographers, and technological advancements that shaped the history of photography. The template consists of vertical infographics, making it easy to present information in a visually appealing and organized manner. It is compatible with Powerpoint, Keynote, and Google Slides, ensuring seamless customization and adaptability to your specific needs.


7 slides
Advanced Education Infographics
The "Advanced Education" infographic template is a sophisticated and visually engaging resource, designed meticulously for PowerPoint, Keynote, and Google Slides. This template is an invaluable tool for educators, administrators, and policy makers aiming to present complex educational frameworks, advanced curriculum details, and innovative learning methodologies. The template expertly encapsulates the essence of advanced education, highlighting specialized programs, cutting-edge research opportunities, and pathways for academic excellence. It's organized to showcase the breadth and depth of advanced educational offerings, making it perfect for academic conferences, institutional presentations, or educational policy discussions. The design is as intellectually stimulating as the content it represents, with a color scheme that is both elegant and conducive to a learning environment. This not only enhances the visual appeal of the presentation but also aligns with the advanced and scholarly nature of the content. Whether used in a university setting, a professional development seminar, or a policy briefing, this template ensures that the value and intricacies of "Advanced Education" are communicated with sophistication, clarity, and visual impact.