Features
- 5 Unique slides
- Fully editable and easy to edit in Microsoft Powerpoint, Keynote and Google Slides
- 16:9 widescreen layout
- Clean and professional designs
- Export to JPG, PDF or send by email
Recommend
7 slides
Social Media Engagement Infographic
Social media is the most influential tool in today's world. This infographic template is a great way to share the benefits of your services in an easy-to-read format that's sure to get your audience excited about what you have to offer. Whether you're looking to promote a new product line or simply want to provide information to your customers so they can make informed decisions, this infographic will be perfect for your needs. This infographic will help you understand how to use social media to engage with your audience and drive traffic to your site. Fully customizable and compatible with Powerpoint, Keynote, and Google Slides.
5 slides
Fishbone Diagram for Root Cause Analysis Presentation
Identify and Solve Business Problems with Precision using this Fishbone Diagram for Root Cause Analysis presentation template. Designed to visually map out potential causes, this template enhances problem-solving, decision-making, and process improvement. Featuring a clear fishbone structure, customizable icons, and text placeholders, this template is perfect for business analysts, strategists, and operations teams. Fully editable and compatible with PowerPoint, Keynote, and Google Slides, ensuring a seamless and professional presentation experience.
4 slides
Customer Market Segmentation Analysis Presentation
Understand your audience with clear and effective segmentation analysis. This Customer Market Segmentation Analysis template provides a professional visual representation of audience groups, helping businesses target the right demographics. Ideal for marketers, business strategists, and sales teams. Fully editable and compatible with PowerPoint, Keynote, and Google Slides for seamless customization.
5 slides
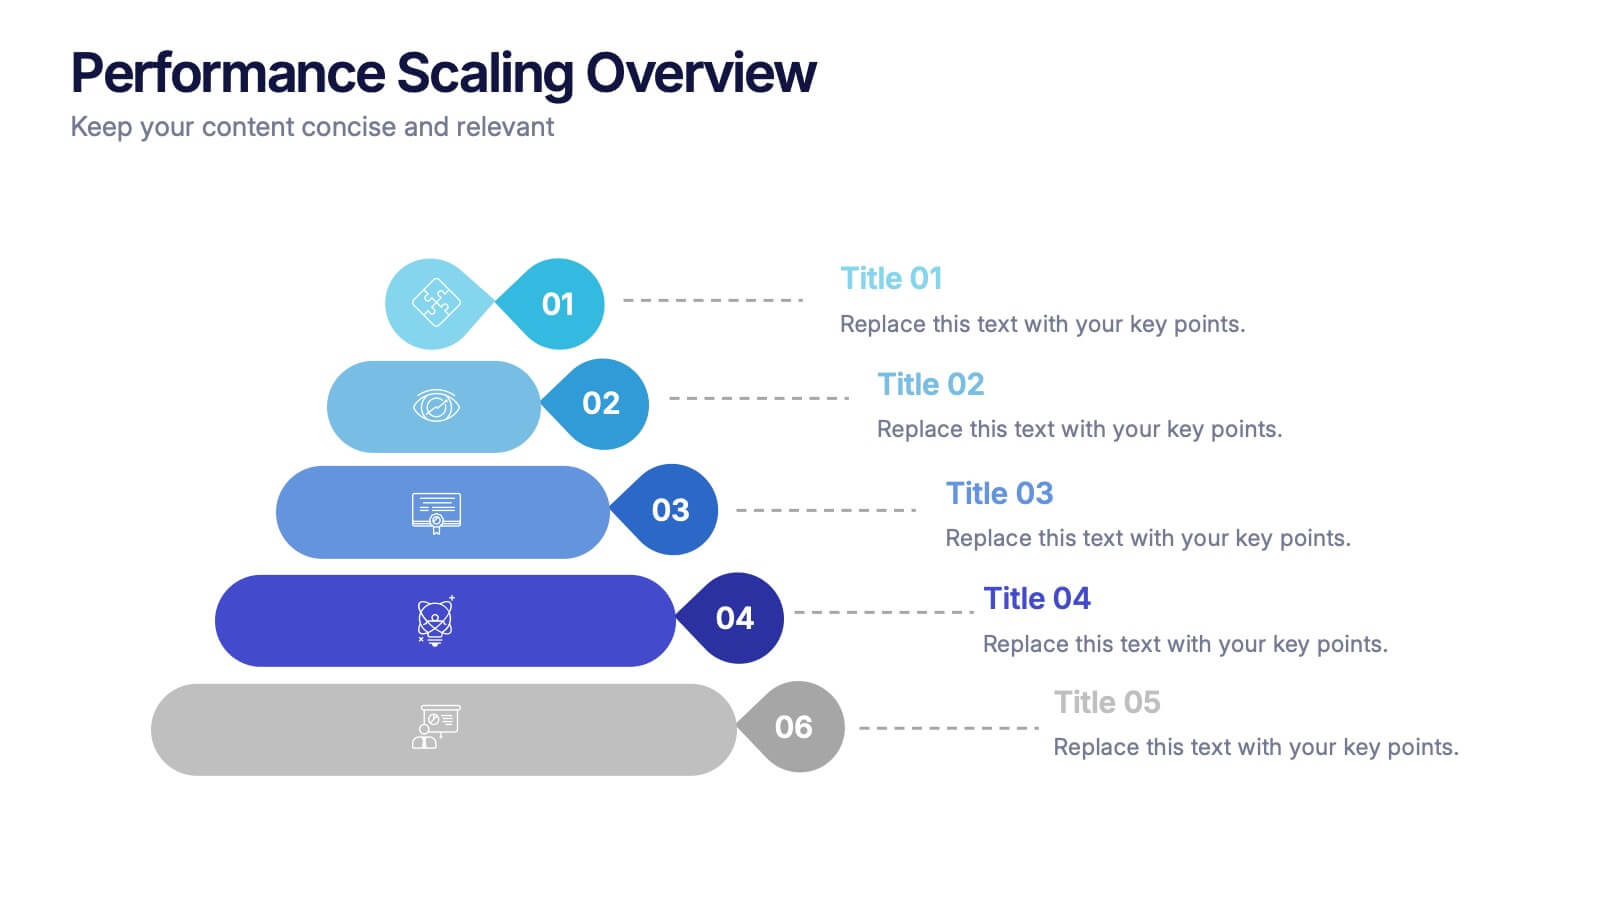
Performance Scaling Overview Presentation
Illustrate performance development with this sleek layered pyramid chart. Designed to visualize growth stages, team levels, or scaling strategies, each tier includes editable text and icons for clarity. Ideal for business reviews, capability mapping, or operational planning. Fully customizable in PowerPoint, Keynote, and Google Slides for effortless updates.
4 slides
Feature Comparison Using Harvey Balls Presentation
Easily visualize performance levels with the Feature Comparison Using Harvey Balls Presentation. This slide is perfect for showing side-by-side comparisons across multiple categories, using universally understood Harvey Ball icons to represent completeness or satisfaction. Ideal for product evaluations, vendor selections, or strategic reviews. Fully editable in PowerPoint, Keynote, and Google Slides.
6 slides
Product Pricing Table Comparison
Make your pricing pitch clear and compelling with this vibrant comparison table template designed for easy decision-making. Whether you're showcasing subscription plans, service tiers, or product bundles, this slide helps highlight key features and value differences at a glance. Fully editable in PowerPoint, Keynote, and Google Slides.
6 slides
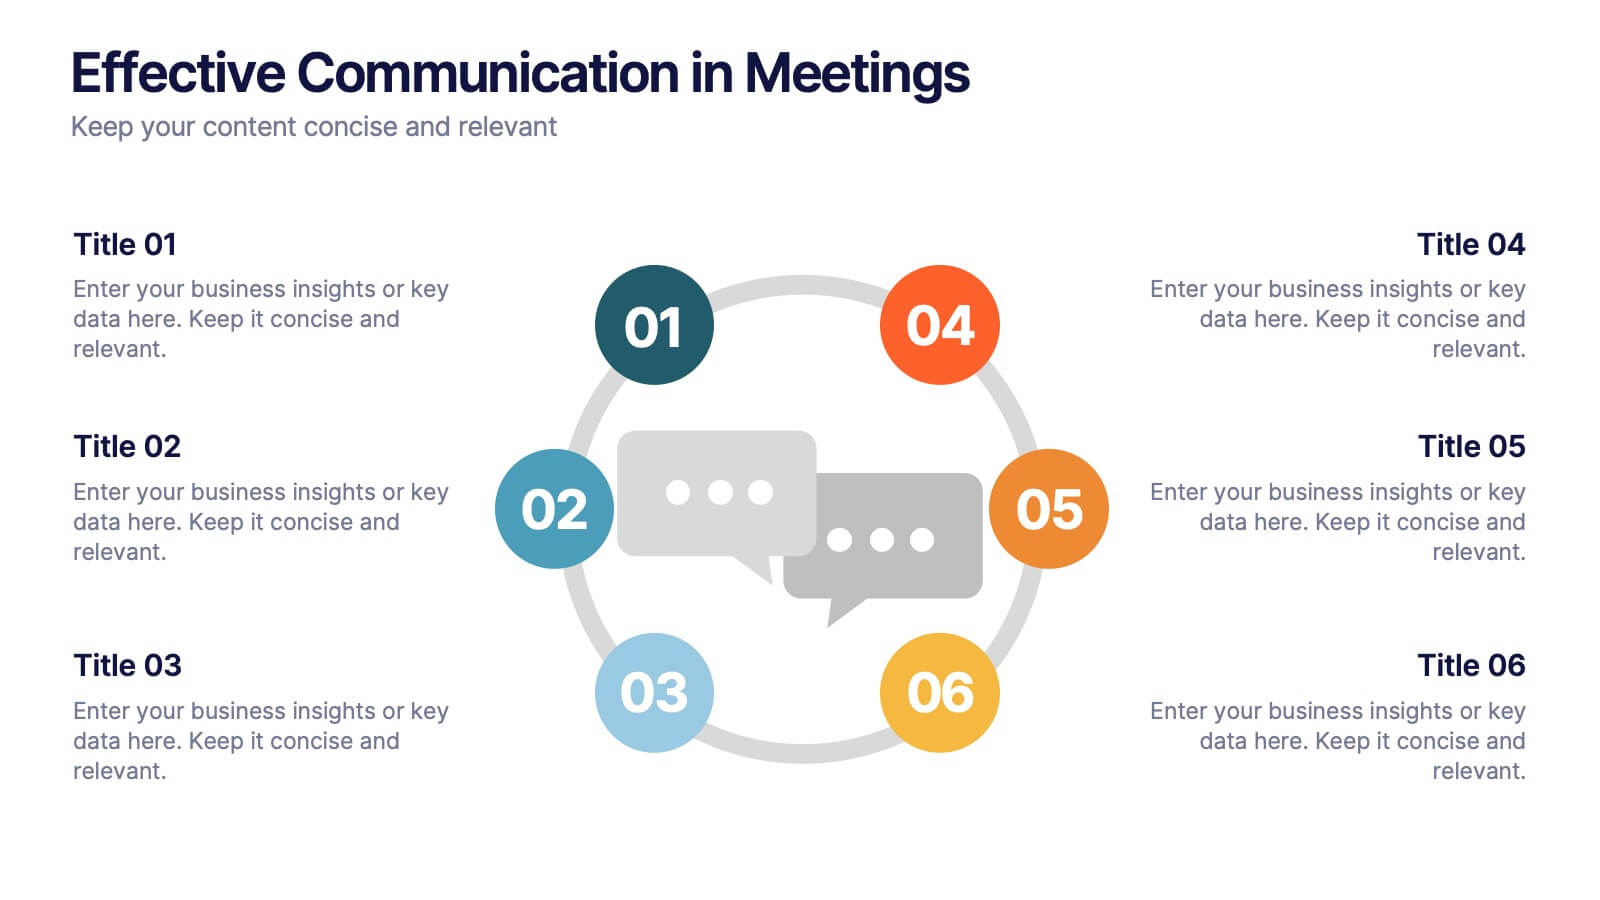
Effective Communication in Meetings Presentation
Communicate with impact using this circular diagram template designed to visualize six key elements or steps for better meeting communication. With centered speech bubble icons and balanced layout, it's ideal for sharing best practices, communication roles, or team feedback loops. Fully customizable in PowerPoint, Keynote, and Google Slides.
7 slides
Compliance Gap Analysis Infographic
Navigate the complexities of organizational compliance with our compliance gap analysis infographic. Using a vibrant palette of orange, white, and green, this infographic elucidates the differences between current compliance practices and desired standards. Specifically designed for business analysts, compliance officers, and risk managers, this template is an invaluable tool to identify, analyze, and bridge compliance-related gaps. With its fun yet informative style, communicating these insights becomes more engaging and understandable. This infographic is ready for integration with PowerPoint, Keynote, and Google Slides, ensuring smooth presentations across various platforms.
6 slides
Decision Flow Diagram Presentation
Make complex decisions easier to follow with the Decision Flow Diagram Presentation. This clean and logical layout breaks down two main options and guides viewers through possible outcomes using a visual tree structure. Featuring checkmark and X icons to clearly denote decisions, this template is ideal for strategic planning, operations, or troubleshooting. Includes light and dark modes, editable in PowerPoint, Keynote, and Google Slides.
26 slides
Water Pollution in the Pacific Presentation
Water Pollution in the Pacific refers to the contamination of water bodies in the Pacific Ocean, which can have severe consequences for marine life, ecosystems, and human health. This template is designed to raise awareness about the critical issue of water pollution in the Pacific Ocean. This template can effectively convey the urgency and significance of addressing water pollution in the Pacific Ocean. This serves as a powerful tool to educate and inspire individuals, organizations, and policymakers to take action and work towards sustainable solutions for the preservation of our precious marine ecosystems.
6 slides
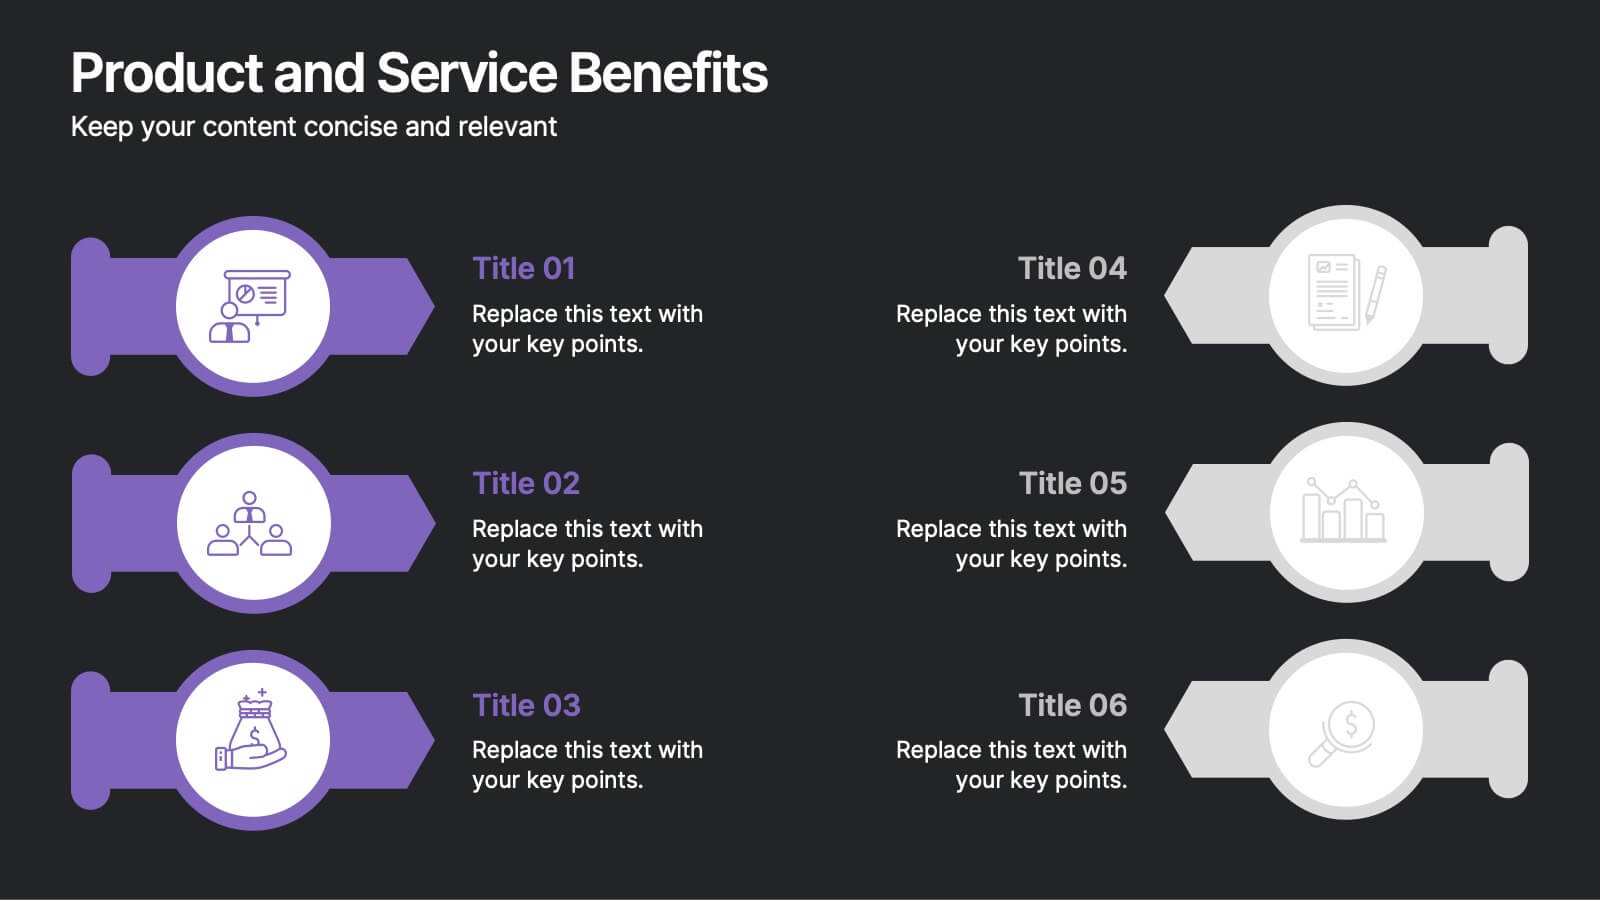
Product and Service Benefits Presentation
Highlight the unique value of your offerings with this Product and Service Benefits Presentation. Designed for clarity and impact, this visual layout allows you to break down six key features or advantages side-by-side. Perfect for product launches, sales decks, or service comparisons. Easily customizable in PowerPoint, Keynote, and Google Slides — ideal for marketers, sales teams, and consultants.
26 slides
Abstract Cool Tone Medical Presentation
Health services are vital for maintaining the health and wellbeing of individuals and communities they includes a wide range of services. This template is perfect for your next presentation on medical topics. Featuring a range of customizable text, bullet points, charts, photo layouts and graphics, these will be sure to get your message across. This template is designed for use with Powerpoint, Keynote, and Google Slides making it easy to visualize medical data and insights. With its cool tone color scheme and abstract graphics, this template is perfect for showcasing important medical concepts.
12 slides
5 Steps Timeline Template
Visualize your project's progress with our vibrant "5 Steps Timeline Template." This infographic template guides you through the years 2030 to 2070, with colorful, distinct markers for each milestone. Ideal for long-term planning, each slide offers a clear path forward, ensuring your goals are both visual and attainable. Compatible with PowerPoint, Keynote, and Google Slides, this template is perfect for professionals eager to showcase their strategic vision in a memorable way.
6 slides
Academy Sports Infographic
Sports are physical activities or games that involve individual or team competition and are typically governed by specific rules. This infographic template highlights key aspects of sports and physical activities in an academy setting. Whether it's a school sports program, a community sports academy, or a professional training institute, this infographic provides a comprehensive overview of the benefits, programs, and facilities offered by an academy sports institution. This template is compatible with Powerpoint, Keynote, and Google Slides making it easy to navigate and can be easily customized to fit your presentation needs.
6 slides
Pillar Ideas Infographic
"Pillar ideas" usually refer to the fundamental principles, concepts, or key components that form the foundation of a particular topic, strategy, or framework. This infographic template outlines and explains the core pillars or key principles of a particular topic, concept, or strategy. These pillars are essential for understanding and implementing the core aspects of that subject. The pillars included in the infographic provide structure and a clear understanding of the foundational elements that contribute to the success and effectiveness of various endeavors. This template is compatible with Powerpoint, Keynote, and Google Slides.
7 slides
Annual Credit Report Infographic Presentation
An Annual Report Infographic is a visual representation of the key information contained in a company's annual report. This template can be used to provide detailed financial information, performance metrics, and other important data that shareholders and stakeholders need to assess a company's health and growth prospects. This infographic is a popular way to present your information in a more easily digestible and visually appealing format. Included in this template are graphs, charts, tables, icons, and other visual elements that help convey complex data in a clear and concise manner.
4 slides
Market Expansion Strategy in South America Map Presentation
Visualize growth opportunities with this South America market expansion map. Designed with directional arrows and regional color highlights, it helps communicate entry strategies, investment plans, or operational shifts. Ideal for business reports or strategy decks. Easily customizable and compatible with PowerPoint, Google Slides, and Keynote for seamless editing.


