


Features
- 6 Unique slides
- Fully editable and easy to edit in Microsoft Powerpoint, Keynote and Google Slides
- 16:9 widescreen layout
- Clean and professional designs
- Export to JPG, PDF or send by email


Do you have any questions?
Recommend


7 slides
Comparative Analysis with Butterfly Chart
Showcase side-by-side insights with clarity using the Comparative Analysis with Butterfly Chart Presentation. Designed for balanced visual storytelling, this template contrasts two sets of three data points��perfect for comparing teams, strategies, features, or timelines. The symmetrical butterfly layout draws focus to the center "VS" section, ideal for highlighting your core comparison or conclusion. Fully editable in PowerPoint, Keynote, and Google Slides for fast, tailored presentations.


6 slides
Fishbone Diagram
A fishbone diagram, also known as a cause-and-effect diagram or an Ishikawa diagram, is a visual tool used to identify and analyze the potential causes of a problem or an effect. This infographic template is designed to help you explore and understand the root causes of an issue by visually mapping out various contributing factors. This cause-and-effect diagram, provides a structured approach to identify and categorize the various factors contributing to a specific outcome. This template is fully customizable and compatible with Powerpoint, Keynote, and Google Slides making it easy to input your information.


6 slides
Harvey Ball Assessment Infographics
Evaluate performance or satisfaction with our Harvey Ball Assessment infographic template. This template is fully compatible with popular presentation software like PowerPoint, Keynote, and Google Slides, allowing you to easily customize it to represent and communicate assessment results using Harvey Balls. The Harvey Ball Assessment infographic template offers a visually engaging platform to visually depict evaluations, ratings, or levels of satisfaction using Harvey Balls. Whether you're a manager, HR professional, or evaluator, this template provides a user-friendly canvas to create informative presentations and reports to convey assessment outcomes effectively. Enhance your assessment reporting with this SEO-optimized Harvey Ball Assessment infographic template, thoughtfully designed for clarity and ease of use. Customize it to showcase assessment data, ratings, and scores, making it a valuable tool for sharing performance or satisfaction levels with your audience. Start crafting your personalized infographic today to communicate your assessment results efficiently.


6 slides
Remote Work Productivity Presentation
The "Remote Work Productivity" presentation template features a clean and modern design, ideal for showcasing strategies and statistics related to remote work efficiency. Each slide allows for the display of key data points and statistics, supported by visual elements like percentage indicators and progress bars that enhance the presentation��s readability and impact. This template is perfect for businesses looking to improve remote operations or present data-driven insights into remote work performance, making it easier for viewers to grasp the effectiveness of remote work policies and tools.


6 slides
Tourism and Hospitality Industry Trends Presentation
Visually map out emerging trends with this engaging circular infographic layout. This slide features six labeled segments connected to a central tourism icon, ideal for highlighting key industry insights, traveler behavior shifts, or hospitality service updates. Sleek and professional, it's perfect for travel agencies, hotel chains, or tourism reports. Fully customizable in PowerPoint, Keynote, and Google Slides.


21 slides
Dewspire Project Management Plan Presentation
Streamline your project planning process with this visually striking and organized presentation template. Perfectly designed to communicate every stage of your project management, it features sections for problem analysis, objectives, and the scope of work. The timeline, budget breakdown, and resource allocation slides ensure your plans are both clear and actionable. Highlight team expertise with dedicated meet the team layouts and showcase your commitment to quality through evaluation criteria and risk management plans. Ideal for team presentations or client proposals, this template supports PowerPoint, Google Slides, and Keynote, offering full customization for seamless adaptability. Deliver your project vision with confidence and precision!


6 slides
Economic Trends in Africa Map Presentation
The Economic Trends in Africa Map template visually presents economic data across Africa. It displays regional economic shifts and trends, using an interactive map and related graphs. Ideal for analysts and investors, it offers clear insights for strategic decisions. Compatible with PowerPoint, Keynote, and Google Slides.


12 slides
Strategic Planning with Strategy Wheel Presentation
Visualize your roadmap with this sleek strategy wheel template. Perfect for showcasing up to six strategic stages, this layout highlights progression while keeping your content organized and engaging. Ideal for business plans, project development, or performance cycles. Fully editable in PowerPoint, Keynote, and Google Slides.


7 slides
IT Architecture Infographics Presentation Template
Our IT Architecture Infographic template is designed to help you create a quick, easy and simple-to-understand presentation that explains your IT Architecture. This template will provide you with material to set out your ideas and give an overview of what��s important so that you can rapidly make progress in this area. This is a perfect choice to impress your clients, teachers, students, or employees. This presentation creates an extravagant feeling that will invite investors and clients to become invested in your project. This template is well-organized and perfect for your next presentation!


7 slides
RACI Matrix Process Infographic Presentation
A RACI matrix is a project management tool that is used to clarify and define roles and responsibilities for project tasks and deliverables. Use this template to help you quickly create RACI charts for your next project. Made up of strategic box with shapes, colors, numeric value and text boxes that can be edited easily. This Template is a multipurpose slide as it can be used to present data visually, build a discussion on the topic and influence your audience to take action. Save time and energy with this infographic template, compatible with Powerpoint, Keynote and Google Slides.


21 slides
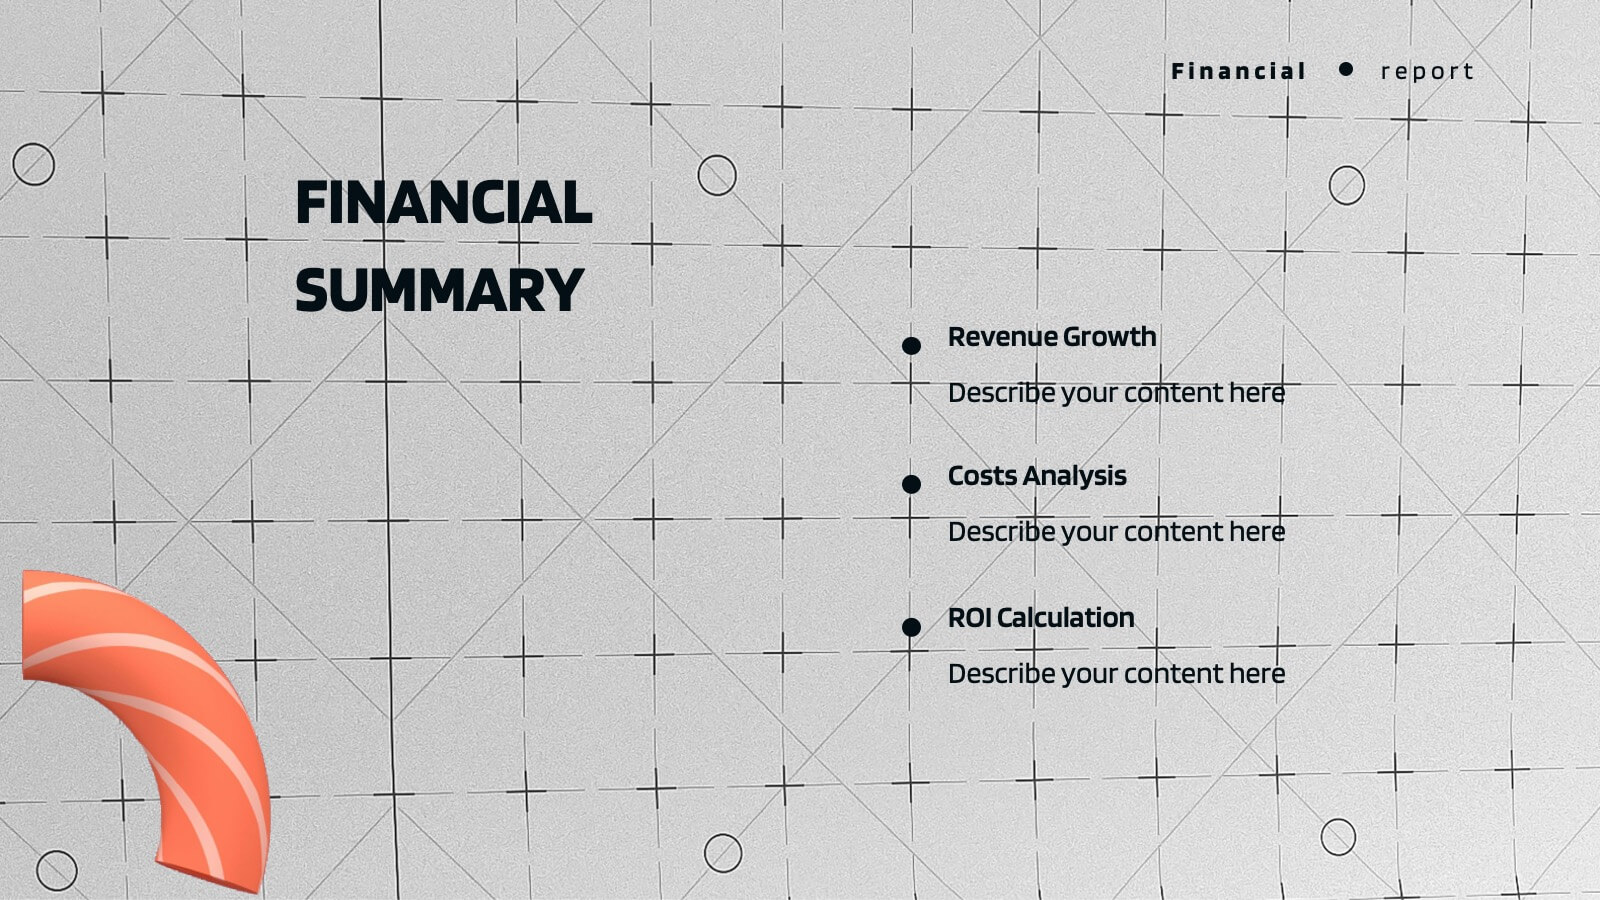
Synergywave Financial Report Presentation
Deliver your financial insights with clarity using this comprehensive report presentation! It covers key sections like performance metrics, sales updates, market trends, and strategic initiatives, ensuring all critical data is well-organized. Whether for stakeholders or internal reviews, this template ensures seamless communication. Fully compatible with PowerPoint, Keynote, and Google Slides.


5 slides
DMAIC Six Sigma Framework
Visualize process improvement with this clear and structured DMAIC Six Sigma slide. Perfect for business analysts, quality teams, and project managers, it highlights each phase��Define, Measure, Analyze, Improve, and Control��in a streamlined format. Fully editable in PowerPoint, Keynote, and Google Slides.


8 slides
Corporate Annual Summary Report Presentation
Visualize your company's yearly progress with the Corporate Annual Summary Report Presentation. This professional template highlights quarterly results using progress circles and percentage data, making it easy to track key milestones and performance. Perfect for board meetings and stakeholder reports. Fully editable in Canva, PowerPoint, and Google Slides.


6 slides
Unique Intersection Comparison Diagram
Illustrate complex relationships with clarity using the Unique Intersection Comparison Diagram Presentation. This visually engaging 5-circle diagram highlights overlaps and distinct points, ideal for showcasing cross-functional collaboration, multi-variable strategies, or layered comparisons. Each segment supports titles and brief text, making it perfect for business planning, product features, or audience segmentation. Fully editable in PowerPoint, Keynote, and Google Slides.


2 slides
Professional Introduction Slide Presentation
Make a lasting first impression with this Professional Introduction Slide. Designed for business presentations, personal branding, and team introductions, this modern layout features bold shapes, a photo placeholder, and space for key details. Ideal for PowerPoint, Keynote, and Google Slides, this fully editable template lets you customize colors, text, and images to match your brand identity.


5 slides
Pricing Strategy and Comparison Table Presentation
Present your pricing plans with clarity and impact using the Pricing Strategy and Comparison Table Presentation. This slide offers a structured layout to compare features, pricing tiers, and plan benefits side-by-side. Perfect for SaaS, services, or product pitches. Fully editable in Canva, PowerPoint, Google Slides, and Keynote.


16 slides
Professional Presentation
Streamline your project presentations with our Professional Template, meticulously designed to bring your content to life. This template is ideal for professionals looking to present a structured and detailed overview of their projects. Starting with a compelling cover slide, it guides you through defining your problem statement, setting clear objectives, and laying out comprehensive strategies and recommendations. The slides are curated to facilitate a logical flow from an introduction of your project to a detailed implementation plan, visual graphics, and outcome analysis. The key objectives slide is engineered to present your goals with impact, while the strategies and implementation plan slides help articulate the steps towards achieving success. The template concludes with a neat summary slide, a cordial 'Thank You' slide with contact information, and a credits section for source attribution. Fully compatible with PowerPoint, Keynote, and Google Slides, this template is a reliable choice for professionals seeking to convey their message with clarity and confidence.